
Data Visualization: The Key to Increased Sales - PowerPoint PPT Presentation
Title:
Data Visualization: The Key to Increased Sales
Description:
Data visualization with Dynamics CRM map plugin helps collect valuable insights faster and easily and strategize sales activities accordingly for better sales. – PowerPoint PPT presentation
Number of Views:32
Title: Data Visualization: The Key to Increased Sales
1
Data Visualization The Key to Increased Sales
Analyzing CRM data properly is as important as
collecting data to reach the right decisions.
Just as the ways to collect data differ as sign
up forms, surveys, calls, etc. ways to analyze
that data differ too. And data visualization is
one of the most important ones among them. The
human brain is wired for visualization Never
found a newborn reading a book, have you? But
found the same baby reacting to visuals? YES!
Does it click something in your mind? That
humans have that innate ability to understand
visuals faster.
2
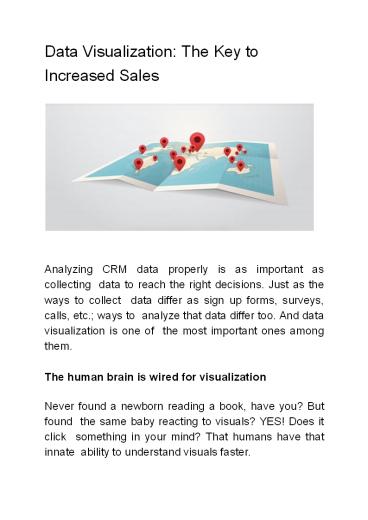
- The same logic goes with CRM data. Rather than
analyzing complex data in the form of numbers
and figures, visualizing it makes it much easier
and faster. - Various plugins like Dynamics 365 map integration
for Dynamics lets you plot CRM records on the
map. This entity mapping like Dynamics CRM field
mapping not only makes data presentation
aesthetically better but also easily
comprehensible. - Now that you have understood the core reason
behind the need for data visualization, read on
to know how it can help grow your organization. - Better Utilization of Time at Hand
- With Dynamics CRM field mapping, sales reps can
utilize the available time to a maximum. With an
easy view of filtered data as per region,
territory, proximity, or other filters,
scheduling daily activities and appointments
becomes easier. Hence, they can make the best
use of available working hours. - Trend Identification
By creating a category/attribute specific view of
entities on a
Dynamics 365 map, you can understand the core
reasons
behind the success and failure of your
strategies. Further,
3
you can identify the developing trends in a region through you can identify the developing trends in a region through
the visualization of data over a period of time. Accordingly, the visualization of data over a period of time. Accordingly,
you can collaborate with the marketing team to work out you can collaborate with the marketing team to work out
future strategies to strengthen your position in that region.
- Effective Communication in Sales Team
- A sales manager can stay on top of your sales
reps activities. With live tracking, they can
always keep track of their on-field sales reps
whereabouts. They can also add or remove new
routes or activities in real-time as the
situation demands. By creating and sharing
optimized routes with their on-field members,
they can help on-field resources reach out to
more customers in lesser time. - In return, sales reps can also use
check-in/check-out that can give you an
overview of their activities throughout the day.
This movement of information in both directions
helps enhance communication between sales
managers and sales reps. - Effective Territory Management
- With a feature like a region drawing, you can
easily create territories and assign them to
your team members right from within CRM using a
mapping integration like a Dynamics 365 map
plugin. Additionally, you can allot contacts and
leads to
4
- your on-field team members to upkeep efficiency
and productivity. - Goal-Oriented Marketing Approach
- Having acquired full details of the
highest-grossing clients and areas available,
the sales team can forward it to the marketing
team. It can help streamline communication
between sales and marketing teams. Also, the
marketing team can then work out strategies to
engage such high-grossing clients and enhance
sales in all such areas. - The marketing team can also set several goals for
itself and discuss and suggest sales goals for
the sales team. This way, the sales team and
marketing team can work hand-in-hand to
implement targeted location marketing strategies
and boost sales in those locations. - Enhanced Data Visualization
- Be it a Dynamics 365 map plugin or any other,
most of them have features like summary cards or
analytical detailed dashlets. These features
help get a smart overview of sales activity,
open leads, follow-up data, and region-wise
performance, and more. With all these insights,
planning daily or monthly activities becomes
easier and more efficient.
5
- Actionable Information
- Besides Dynamics CRM field mapping, heat map
plotting also makes visualizing and analyzing
the CRM data in real-time possible. With
area-wise heat maps, pie charts, column charts,
etc. you can get deeper insights into data and
take more efficient and data-driven decisions
accordingly. - Ease of Navigation and Use
- Generally, a Dynamics CRM map plugin or others
come with the support for not only Google Maps
but also others like Apple or Waze. Therefore,
on-field sales reps can easily navigate to
assigned clients, leads, or contacts by accessing
the defined routes from any map they prefer. - Further, they can also personalize their map view
with user-level configuration. By configuring
minor details like auto zoom and default
location, they can save manual efforts and time
in accessing frequently required data. - Improved Security
- At times, sharing data of all modules with all
team members may not be secure. To help you
filter what to share with whom, a Dynamics 365
map integration lets you create security
templates.
6
You can just filter the fields of every module
once and save them in a security template. This
helps you save the time in switching between
modules and filtering the fields you need to
share every now and then. You can simply create
multiple security templates containing data as
per team members frequent requirements.
Whenever a team member asks for it, you can
share one of the pre-created security templates
as per their requirements. Final Thoughts Data
visualization is indeed a very crucial aspect
when it comes to analyzing CRM data. Dynamics
CRM field mapping not only gives you better
insights into available CRM data but also
streamlines your sales operations and activities.
Recommended
CrystalGraphics Presentations


