
Project:Reduce Copper Levels to Meet the Wastewater Permit Requirements - PowerPoint PPT Presentation
1 / 46
Title:
Project:Reduce Copper Levels to Meet the Wastewater Permit Requirements
Description:
Steve Schroedl, Woody Woodward, Spencer Fisk, Wade Schwan, DePuy Maintenance; ... Johnson saw to it that the Credo was embraced by his company, and he urged his ... – PowerPoint PPT presentation
Number of Views:145
Avg rating:3.0/5.0
Title: Project:Reduce Copper Levels to Meet the Wastewater Permit Requirements
1
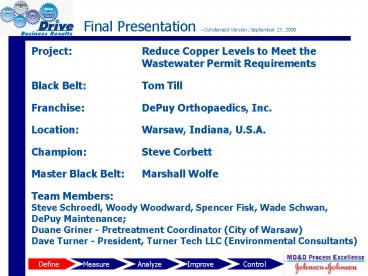
Final Presentation Condensed Version, September
17, 2008
Project Reduce Copper Levels to Meet the
Wastewater Permit Requirements Black
Belt Tom Till Franchise DePuy Orthopaedics,
Inc. Location Warsaw, Indiana,
U.S.A. Champion Steve Corbett Master Black
Belt Marshall Wolfe Team Members Steve
Schroedl, Woody Woodward, Spencer Fisk, Wade
Schwan, DePuy Maintenance Duane Griner -
Pretreatment Coordinator (City of Warsaw) Dave
Turner - President, Turner Tech LLC
(Environmental Consultants)
Define
2
The DePuy Warsaw Facility 2
3
The Johnson Johnson Credo 3
- In 1943, General Robert Wood Johnson wrote and
published the Johnson Johnson Credo, a one-page
document outlining Johnson and Johnsons
corporate responsibilities in detail. Johnson saw
to it that the Credo was embraced by his company,
and he urged his management to apply it as part
of their everyday business philosophy. - Customers
- Employees
- Communities
- Stockholders
- Johnson believed that by putting the customer
first the business would be well served, and it
was.
4
The JJ Credo 4
- Our Credo
- We believe our first responsibility is to the
doctors, nurses and patients,to mothers and
fathers and all others who use our products and
services.In meeting their needs everything we do
must be of high quality.We must constantly
strive to reduce our costsin order to maintain
reasonable prices.Customers' orders must be
serviced promptly and accurately.Our suppliers
and distributors must have an opportunityto make
a fair profit. - We are responsible to our employees,the men and
women who work with us throughout the
world.Everyone must be considered as an
individual.We must respect their dignity and
recognize their merit.They must have a sense of
security in their jobs.Compensation must be fair
and adequate,and working conditions clean,
orderly and safe.We must be mindful of ways to
help our employees fulfilltheir family
responsibilities.Employees must feel free to
make suggestions and complaints.There must be
equal opportunity for employment, developmentand
advancement for those qualified.We must provide
competent management,and their actions must be
just and ethical. - We are responsible to the communities in which we
live and workand to the world community as
well.We must be good citizens support good
works and charitiesand bear our fair share of
taxes.We must encourage civic improvements and
better health and education.We must maintain in
good orderthe property we are privileged to
use,protecting the environment and natural
resources. - Our final responsibility is to our
stockholders.Business must make a sound
profit.We must experiment with new
ideas.Research must be carried on, innovative
programs developedand mistakes paid for.New
equipment must be purchased, new facilities
providedand new products launched.Reserves must
be created to provide for adverse times.When we
operate according to these principles,the
stockholders should realize a fair return.
5
The JJ Credo 5
- From the JJ Credo
- We are responsible to the communities in which
we live and workand to the world community as
well. - We must maintain in good orderthe property we
are privileged to use,protecting the environment
and natural resources.
6
Business Case 6
- DePuy Warsaws waste water contains copper levels
that exceeds permitted levels resulting in - Non-compliance to city permit
- (0.300 ppm max. daily, 0.150 ppm avg. monthly)
- (300 ug/L max. daily, 150 ug/L avg.
monthly) - JJ Guidelines mandate permit compliance
- Potential Fines
- Threat to the endangered Club Shell Mussel, which
thrives in the Tippecanoe River.
Define
7
Customers 7
- One of our most important Customers
Define
8
Benefits of Project 8
- Financial Benefits
- Project supports 1.95M Cost Avoidance
- Project Supports DePuy meeting our Wastewater
Permit limits and avoid daily violations of 500
to 10,000 per day. - Community Outreach
- Project meets community Outreach Program to help
save the endangered Club Shell Mussel - Most Important Benefit
- Resolve the Needle in the Haystack problem
identifying the root cause of the high copper
levels, and implement permanent solutions to
solve the problem.
Define
9
How Do We Attack This Problem? 9
- Six Sigma was developed by Motorola in the
1980s, and consists of a set of statistical
methods for systemically analyzing processes to
reduce process variation. - Reducing variation is a key step to reducing
scrap and rework. - This presentation will focus on Six Sigma
Define
10
Six Sigma Process Excellence 10
DMAI2C Process
D Define M Measure A Analyze I2
Innovative Improvement C Control
11
Six Sigma Process Excellence 11
DMAI2C Process Tools
12
SIPOC Analysis Example 12
S
I
P
O
C
Indiana American Water Company
Piping Water Water Treatment Chemicals
Waste Water
Warsaw Municipal Waste Treatment Plant, then the
Tippecanoe River
PROCESS Use Water
Incoming IN AM Water Company
Distribute Water
Use Water
Discharge directions
Aggregate Waste Water
Send to Treatment Plant
Define
13
Historical Data from 2004 13
Define
14
More Historic Data 14
Historical data says that the copper level in
incoming water was measured at 3 locations on two
separate occasions Location 1, Test 1 0.030
mg/L Location 1, Test 2 0.013 mg/L Location 2,
Test 1 0.120 mg/L Location 2, Test 2 0.132
mg/L Location 3, Test 1 0.100 mg/L Location 3,
Test 2 0.104 mg/L
Define
15
Thought Map 1 Questions 15
Thought map 1 led us through a series of
questions, and we ended up with the most basic
question of all Question Do we have a
measurement system that is adequate for measuring
copper levels to the finite level that we
require? Answer Perform a Gage RR/COV
Analysis.
Define
16
Measurement System Analysis 16
Measure
17
Measurement System Analysis
Measure
18
Measurement System Analysis
Measure
19
Measurement System Analysis 19
Our study tells us that our gage system is more
than adequate to measure copper levels in the
incoming and waste water. It also tells us that
we do not have a high level of copper in the
incoming water.
Measure
20
Test Plan Developed 20
- Develop plan to test waste water.
- Write CAR and install three new effluent sampling
stations - Lease and install seven dedicated sampling
stations - Begin sampling on the morning of November 24,
2005.
Measure
21
Measurement Locations 21
Measure
22
COV Data Collection 22
Measure
23
COV Tree 23
- OUTGOING WATER Location
001 composite line containing
101201301401501601 - INCOMING WATER
Location 701, 801 and
901 Incoming Water Lines
Measure
24
Initial Results w/ Averaging 24
Measure
Analyze
25
Why Use Averaging??? 25
Measure
Analyze
26
Average Because of Low Flow 26
Measure
Analyze
27
ISOC Sampling Stations 27
Measure
Analyze
28
Initial Resultsgt150 ug/L Max28
Measure
Analyze
29
Initial Resultsgt300 ug/L Max29
Measure
Analyze
30
Initial Resultsgt300 ug/L Max30
The composite results on day 34 and 35 are
alarming Even if the daily limit is raised from
150 to 300 ug/L, we will experience
non-compliance.
Measure
Analyze
31
What Have We Learned? 31
- We are close to our 300 ug/L limit many days.
- We are significantly over our limit on some days.
- What are we going to do to solve this problem?
- ?
Measure
Analyze
32
Flow Data 32
Measure
Analyze
33
Mass Balance - How Much Copper Per Pipe? 33
Measure
Analyze
34
Its All Becoming Clearer 34
Loc. 101 29 wastewater volume and 32
copper Loc. 401 65 wastewater volume and 64
copper 94 wastewater volume and 96
copper Copper content follows wastewater flow,
or where there is wastewater volume, there is
copper.
Measure
Improve
Analyze
35
Where Do We Go?
35
Measure
Improve
Analyze
36
Innovative Improvement 1 36
RO Water System
Incoming city water travels 550 feet through 4
supply pipe in 4.8 minutes to reach the RO water
system.During this travel, the copper (Cu)
level increases from 10 ug/L to 200 ug/L.
ACTION ITEM 1 - Replace this copper supply
pipe with CPVC Plastic Pipe!
Measure
Analyze
Improve
37
Copper (Cu) 91.7 X OUR 300 ug/L
LIMIT!!!Maintenance filled 20 five gallon
buckets to clear the flow in this water
line!This is a possible explanation for the
1,210 and 1,400 ug/L Cu result on 12/27/2005 and
12/28/2005!ACTION ITEM 2 - Replace this copper
supply pipe with CPVC Plastic Pipe!
Innovative Improvement 2 37
The City Water in the Prototype Shop is brown
Measure
Analyze
Improve
38
Innovative Improvement Plan 38
- REPLACE SPECIFIC COPPER PIPES
- City of Warsaw verbally approved our plan and
agreed to the December 31, 2006 completion date. - Capital Appropriations Request was submitted and
APPROVED to replace specific copper pipes that
feed the RO System and Prototype Areas - Purchase a sampler and monitor our primary
wastewater outfall - Permit was re-written to 300 ug/L limit
- Follow up with DePuy Environmental and the City
of Warsaw to ensure that we remain within
compliance.
Measure
Analyze
Improve
39
Copper Pipe Replacement 39
COPPER PIPE REPLACEMENT COMPLETED SEPTEMBER 17,
2006. 117 days of composite line sampling began
August 28, 2006 and continued through January 12,
2007. 7 days of CONTROL sampling began September
17 and continued through September 23, 2007.
Measure
Improve
40
CONTROL 40
- MICROSOFT EXCEL DATA
- (more conservative, used by the City of Warsaw)
- One Year ALL
- BEFORE AFTER Follow-Up Data
- (48 Days) (117 Days) (7 Days) (124 Days)
- Avg 245 ug/L 49.8 ug/L 53.6 ug/L 50.0 ug/L
- Std Dev 234 ug/L 28.7 ug/L 34.8 ug/L 28.9
ug/L - UCL 947 ug/L 135.8 ug/L 157.9 ug/L 136.7 ug/L
- Maximum 300 ug/L
Control
41
CONTROL 41
- PIPE REPLACEMENT - MINITAB DATA
- One Year ALL
- BEFORE AFTER Follow-Up Data
- (48 Days) (117 Days) (7 Days) (124 Days)
- Avg 245 ug/L 49.8 ug/L 53.6 ug/L 50.0 ug/L
- Std Dev 87 ug/L 15.3 ug/L 20.5 ug/L 15.9
ug/L - UCL 505 ug/L 95.8 ug/L 115.2 ug/L 97.7 ug/L
- Maximum 300 ug/L
Control
42
CONTROL 42
48 day sampling results of composite line BEFORE
pipe replacement 11/24/2005 thru 1/10/2006
Control
43
CONTROL 43
124 days of sampling results of composite line
AFTER pipe replacement (9/18/2006 - 1/12/2007
9/17/2007 9/23/2007)
Control
44
CONTROL 44
Sampling results of composite line BEFORE AFTER
pipe replacement
Control
45
DMAI2C Tool Usage 45
- Define Charter, SIPOC, VOC, Thought Map
- Measure VOC, Gage RR, Thought Map, COV, I-MR
Charts - Analyze - VOC, Thought Map, I-MR Charts, Mass
Balance Analysis - Improve Innovate VOC, Copper Pipe
Replacement Project Defined - Control VOC, Continued Testing Before and
After Pipe Replacement
46
Questions/Comments 46
Questions/Comments ?
47
Questions/Comments 47
THANKS For Your Attention!
48
(No Transcript)
Recommended
CrystalGraphics Presentations


