
Powerpoint template for scientific poster
1 / 1
Title:
Powerpoint template for scientific poster
Description:
You may use this template for educational and non-profit use. Please acknowledge its source, and please send feedback to: purrington_at_swarthmore.edu. If you are ... – PowerPoint PPT presentation
Number of Views:57
Avg rating:3.0/5.0
Title: Powerpoint template for scientific poster
1
Integration of multimodal cues Temporal
segmentation visual motion Robert Sekuler and
Victoria Wong Volen Center, Brandeis
University, Waltham MA
G10
2004
Conclusions We assumed that streaming is the
default perceptual response to our basic
stimulus, and that departures from default are
governed by evidence -- unimodal or multimodal --
of a perturbation in the discs trajectories.
Not all putative cues actually affect the
bistable percept. For example, pr(bouncing) is
unaffected when the discs deform so as to
simulate a collision between non-rigid objects.
We cannot rule out the possibility, though, that
this ineffective cue might gain power when
combined with other cues. The quality of fit
achieved by the Cue-Specific Weights model was
good, but showed a small, systematic error at the
highest predicted values (Fig. 3D). The error
suggests that the simple, linear summation model
may have ignored a genuine, but small, non-linear
interaction among cue effects. It seems that all
cues lose some potency when placed in
combination. The loss is most substantial for the
two time-based cues, Duration and Timing. It
remains to be seen whether this result is merely
coincidental, or signifies a genuine difference
between time-related cues and other cues. The
reduction of individual cues influence in
mixture is qualitatively consistent with a recent
fMRI study. Using a stimulus like ours, Bushara
et al. (2003) presented a brief sound when the
moving discs coincided. Brain activation
patterns associated with the two perceptual
outcomes, streaming and bouncing, suggested a
competitive interaction between a system of
multi-modal regions and a system of predominantly
unimodal regions. Activation in unimodal regions
diminished when the sound promoted bouncing,
which seems to parallel the failure of complete
summation in our results. As Bushara et al. used
just one value for sound timing and intensity,
other comparisons are impossible. Finally, to
avoid possible saturation, our individual cues
were relatively weak, which maximizes linear or
near-linear summation. We cannot say whether
linear summation would continue to hold with
stronger cues.
Three nested, linear sum models We evaluated
three other, nested models. Each assumes that
influences from various cues sum linearly, but
the models differ in their depictions of the
summing process. The Equal Weights model is
structurally simple When w1, the model has
no free parameters the prediction for any
combination is given by the sum of the component
probabilities. This prediction is shown by the
solid line in Fig. 3B. With RMSD0.058, it fares
more poorly than Winner Take All. Treating w as
a free, scaling parameter improves the fit (shown
by dashed in Fig. 3B), with RMSD0.018.
Although all cues had been adjusted to produce
equal effects individually, when placed into
combination, some cues gained, while other cues
lost influence. Generally, the two visual cues
retained stronger influence. Therefore, we
tested a Modality-Specific Pooling model, which
sums cues effects within separate
modality-specific pools. This model is described
as where Vi and Ai are the ith visual and
auditory cues, and wM is the weight for modality
M. Weights were determined by multiple linear
regression with dummy variables interaction
terms were set to zero. The weight for visual
cues was 5x the weight for auditory cues. The
two free, modality-specific parameters produced a
slightly-improved fit (Fig. 3C), with RMSD
0.015. The final model, Cue-Specific Weights,
added two additional free parameters, assigning
each of the four cue types its own weight, wi
The additional free parameters reduced RMSD to
0.073 (Fig. 3D). The Akaike Information
Criterion, which takes account of a models
degrees of freedom when evaluating its goodness
of fit, identified the Cue-Specific Weights model
as far superior to the other nested, linear
models.
Introduction The visual worlds continuous stream
of spatio-temporal events must be segmented into
appropriate constituents. Normally, visual
segmentation cues are accompanied by correlated
inputs from other senses. Content-based,
automatic image recognition systems can learn to
exploit correlated multi-sensory information (Rui
et al., 2001). Can humans do the same? And if
so, what rules are used to harmonize multiple
segmentation cues? For answers, we studied
responses to a bistable motion stimulus whose
visual outcome varies with perceived
segmentation. The basic stimulus is shown in
Fig. 1.
Results Cues one at a time
Results from 10 subjects showed that pr(Bouncing)
increased as The coincident discs contrast
momentarily decreased The discs period of
coincidence lengthened The added sound increased
in intensity The sound occurred near the time
when the discs coincided.
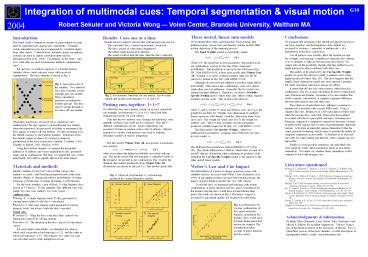
Fig. 1. Space-time plot of the stimulus. Two
identical discs move steadily toward and then
past one another. Their coincidence generates an
ambiguous, bistable percept The discs seem to
stream through or to bounce off one another.
Fig. 2. Psychometric functions for one subject.
Arrows mark stimuli that produce pr(bouncing)
0.21 and 0.33.
Putting cues together 11? We added the four
cues together, in pairs or in trios, using both
cue strengths, pr(bouncing) 0.21 or 0.33, which
had been estimated previously for each subject.
Note that the two auditory cues (Timing and
Duration), were mutually exclusive and could not
be combined. This left 37 different combinations
of cues. Each combination was presented 24 times
in random order to the 10 subjects. Subjects
responses to various combinations were used to
evaluate alternative models of sensory
integration. The first model, Winner Take All,
incorporates a non-linear, max operator where
max returns the highest probability associated
with any cue. The model asserts that
pr(bouncing) is controlled solely by the
strongest cue present in any combination. Fig. 3A
plots the obtained data against predictions from
Winner Take All. (Predictions are shown by the
red Xs.) This model clearly fails.
When their trajectories are perceived as
continuous and uninterrupted, the discs appear to
stream through one another when the trajectories
are perceived as broken or interrupted, the discs
appear to bounce off one another. We take
streaming to be the default response to the
bistable stimulus. Departures from this default
require evidence of a spatial or temporal
perturbation in the discs trajectories (Sekuler
Sekuler, 1999 Tripathy Barrett, 2003
MacKay, 1958). Using this bistable stimulus,
we gauged the perceptual influences of auditory
and visual segmentation cues, presented singly
and in combination. But first, we equated the
cues so that individually all would be equally
effective for each subject.
Literature mentioned Bushara, K.O., Hanakawa, T.,
Immisch, I., Toma, K., Kansuku, K. Hallett,
P.M. (2003). Neural correlates of cross-modal
binding. Nature Neuroscience 6,
190-195. Dzhafarov, E.N.,, Sekuler, R. Allik,
J. (1993) Detection of changes in speed and
direction of motion Reaction time analysis.
Perception Psychophysics, 54, 733-750. MacKay,
D.M. (1958) Perceptual stability of a
stroboscopically lit visual field containing
self-luminous objects. Nature 181 507-508. Rui,
Y., Gupta, A. Acero, A. (2000) Automatically
extracting highlights for TV baseball programs.
In Proceedings of ACM Multimedia, L. A., Pp.
105-115. Sekuler, A.B. Sekuler, R. (1999)
Collisions between moving visual targets What
controls alternative ways of seeing an ambiguous
display? Perception 28, 415-432. Sekuler, R.,
Sekuler, A.B., Lau, R. (1997) Sound alters
visual motion perception. Nature 385,
308. Tripathy, S.P. Barrett, B.T. (2003) Gross
misperceptions in the perceived trajectories of
moving dots. Perception 32, 1403-1408.
- Materials and methods
- Sekuler, Sekuler Lau (1997) showed that various
cues, auditory or visual, could bias the
perceptual result of the basic stimulus (Figure
1), altering the relative probabilities of seeing
bouncing, pr(bouncing), or seeing streaming,
1-pr(bouncing). - For the basic stimulus, a pair of black, 1.0 deg
diameter discs moved at 5.9 deg/sec. To this
stimulus, four different cues were added two
cues were auditory, two were visual. - Auditory cues
- Timing (T). A single tapping sound, 85 dbSPL
presented at varying times relative to the discs
coincidence. - Intensity (I). The same tapping sound presented
at varying intensity levels, but always while the
discs coincided. - Visual cues
- Contrast (C). When the discs coincided, their
contrast was temporarily reduced by varying
amount. - Duration (D). The duration of the discs period
of coincidence varied. - For each subject individually, we identified the
value at which each cue produced pr(bouncing)
0.21, and the value at which pr(bouncing) 0.33.
The subjects two values for each cue were then
used to study integration of cues.
Webers Law and Cue Impact The detectability of a
pause or change in motion varies with stimulus
velocity, in accord with Webers Law (Dzhafarov
et al, 1993). If perceptual evidence governed the
bistable percept, the impact of pause duration
should also vary with velocity. To test this
idea, we measured pr(bouncing) with twenty
combinations of pause duration and disc speed.
Normalized for the distance that the discs would
have traveled during their pause, the results are
shown in Fig 4. The pauses impact is governed by
perceptual quality, not by physical value alone.
Fig. 3. Observed pr(bouncing) vs. pr(bouncing)
predicted by various alternative models.
Fig. 4. pr(bouncing) for varying combinations of
disc speed and pause duration, normalized for
distance discs would have traveled during pause
had motion not stopped. The normalization takes
account of pause duration and disc speed.
Acknowledgments information We thank Takeo
Watanabe, Larry Abbott, Yuko Yotsumoto, and
Allison B. Sekuler for excellent suggestions.
Victoria Wong is now at the Medical School of the
University of Hawaii. For a a QuickTime version
of the basic stimulus, or a full description of
experimental details, e-mail vision_at_brandeis.edu.
Recommended
CrystalGraphics Presentations


