
Bald Eagle Population in Bay Watershed - PowerPoint PPT Presentation
1 / 38
Title:
Bald Eagle Population in Bay Watershed
Description:
... ahead of schedule. ... model estimates that 340 mlb of nitrogen would be delivered ... it is estimated that 10 mlb would be delivered through the ... – PowerPoint PPT presentation
Number of Views:68
Avg rating:3.0/5.0
Title: Bald Eagle Population in Bay Watershed
1
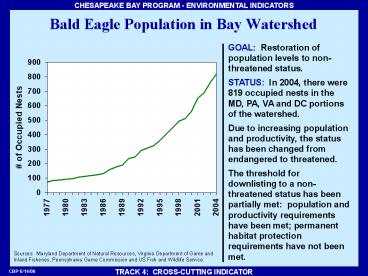
Bald Eagle Population in Bay Watershed
GOAL Restoration of population levels to
non-threatened status. STATUS In 2004, there
were 819 occupied nests in the MD, PA, VA and DC
portions of the watershed. Due to increasing
population and productivity, the status has been
changed from endangered to threatened. The
threshold for downlisting to a non-threatened
status has been partially met population and
productivity requirements have been met
permanent habitat protection requirements have
not been met.
Sources Maryland Department of Natural
Resources, Virginia Department of Game and Inland
Fisheries, Pennsylvania Game Commission and US
Fish and Wildlife Service.
2
Boat Waste Pump-Out Facilities
2010 Goal (789)
GOAL By 2010, expand by 50 the number and
availability of boat waste pump-out facilities to
support no discharge zones in appropriate areas
of the Bay. STATUS As of December 2004, there
were 641 pump-out facilities in the Maryland and
Virginia portions of the Bay. In order to
achieve the goal we need an additional 148 by
2010. Reporting method changed in 2000. See
speaker notes for details.
Pump-Out Facilities
Registered Boats
Data sources VA Department of Health, VA
Department of Game and Inland Fisheries and MD
Department of Natural Resources.
3
Public Access Points to the Chesapeake Bayand
Its Tributaries
GOAL By 2010, expand by 30 the system of
public access points to the Bay, its tributaries
and related resource sites in an environmentally
sensitive manner. STATUS During 2005, the
following has been completed to acquire, develop
or enhance access opportunities 5 new or
enhanced sites in VA, 9 in PA and 5 in MD. This
brings the current total up to 688. In order to
achieve the goal we need 117 more by 2010.
Goal 805 by 2010
Source VA Department of Conservation and
Recreation. Status as of July 2005
4
Water Trails in the Chesapeake Bay Watershed
GOAL By 2005, increase the number of designated
water trails in the Chesapeake Bay region by 500
miles. STATUS During 2005, 135 new water trail
miles were developed. There are currently an
estimated 1,804 miles of water trails in the Bay
watershed. The goal was achieved ahead of
schedule.
Goal 793 by 2005
Source National Park Service, Chesapeake Bay
Program Office.
5
Vehicle Miles Traveled vs. Population in
Chesapeake Bay Watershed
GOAL Encourage efficient development patterns
that lead to reductions in vehicle miles traveled
(VMT). STATUS VMT in the Bay watershed
increased 117 between 1970 and 1997. Population
during the same time increased only 28. VMT are
projected to increase an additional 32 between
1997 and 2010 population is expected to increase
10 during the same time period.
Vehicle Miles Traveled
Population
10 projected increase (1997 2010)
32 projected increase (1997 2010)
28 increase (1970 1997)
117 increase (1970 1997)
Source CBPO Data Center, using EPA OAQPS
(Office of Air Quality Planning and Standards)
data and US Census Bureau data. Adjustments were
made fro counties only partially in the watershed.
6
Estimated Vehicle NOx Emissions vs.Vehicle Miles
Traveled
Estimated Vehicle Miles Traveled
Estimated Vehicle NOx Emissions
GOAL Reduce nitrogen oxide (NOx) emissions from
vehicles to support nutrient reduction
efforts. STATUS The estimated NOx emissions
from vehicles decreased 18 between 1985 and
1997, even as vehicle miles traveled increased
41 during the same time period.
Source NOx emissions from light duty
on-road/highway vehicles and vehicle miles
traveled, for all counties in the Chesapeake Bay
Watershed, CBPO Data Center, using EPA OAQPS
(Office of Air Quality Planning and Standards)
data. Adjustments made for counties only
partially in watershed.
7
Chesapeake Basin Population, Households and
Maryland Development Trends
Chesapeake Basin
Source of Chesapeake Basin data CBPO Data
Center using 1970, 1980, 1990, and 2000 census
data from Geolytics, Inc. and the U.S. Census
Bureau. Source of MD data MD Dept. of Planning,
Planning Data Services. Analysis based on
Building Permits, Decennial Census Data, MD
Property View-2001 Edition( 2000), 2000 Edition
(1997-1999), 1998 Edition (1996 and earlier), and
Priority Funding Area Maps for Maryland
jurisdictions.
The number of households in the Bay watershed
have increased at a faster rate than population
because of reduction in the average household
size between 1970 and 2000. In Maryland average
lot size per household has increased since the
1970s. An increase in households coupled with an
increase in lot size results in land being
consumed for development at a faster rate than
population increase.
Population
Households
34 increase 1970 - 2000
67 increase 1970 - 2000
MD Acres of Residential Development
MD Average Lot Size
MD Population
35 increase 1970 - 2000
66 increase 1973 - 1997
8
Chesapeake Bay Watershed Development Trends
Impervious Cover
Areas of Highest Development Pressure in the
Watershed
GOAL By 2012, reduce the rate of harmful sprawl
development of forest and agricultural land in
the Bay watershed by 30. STATUS Impervious
cover increased from 611,017 to 860,004 acres
between 1990 and 2000. At that rate of increase,
an additional 250,000 acres will become
impervious by 2010. Reducing the rate 30 will
result in 175,000 additional acres of impervious
cover. Achieving the goal will save 75,000 acres
from becoming impervious.
30 Rate Reduction Goal
Source Chesapeake Bay Program
9
Chesapeake Basin Land Use and Pollutant Loads
GOAL To conserve and increase forest land uses,
while reducing the water quality impacts of urban
development and agriculture. STATUS Pollutant
loads from agricultural lands and point source
nutrient loads from urban/suburban lands have
generally declined due to management actions. On
a pound-per-acre basis, taking into account point
and nonpoint sources, urban/suburban areas
deliver the most nutrient pollution to the Bay.
Source Chesapeake Bay Program Phase 4.3
Watershed Model. Nitrogen, phosphorus and
sediment loads are those delivered to the edge of
stream from both point and nonpoint sources from
the entire watershed.
10
Chesapeake Basin Forests
In the 1600s, about 95 of the basin was
forested. In 1990, about 59 was forested. The
forests that re-grew earlier this century are now
steadily declining. Current losses represent
permanent conversions. Forest quality may be as
important as quantity- proximity to water-
species diversity- ecosystem resilience-
habitat fragmentation- economic viability.
Source US Forest Service
11
Riparian Forest Buffer Conservation and
Restoration
Riparian Forest Buffer Restoration
GOAL Conserve and restore forests along at
least 70 of all streams and shoreline in the
watershed, with a near term goal of at least
10,000 miles by 2010. STATUS Between 1996 and
August 2005, 4,606 miles of riparian forest were
restored. As of 1990, approximately 59 of the
riparian area in the basin is forested.
Status of Bay Basin Streambanks and Shorelines
1990s
Current 2010 Goal10,000 miles (established 2003)
Riparian Forest Buffers (59)
Initial 2010 Goal2,010 miles (established 1996)
Source Chesapeake Bay Riparian Forest Buffer
Inventory (9/1/96) and CBPO Data Center
(6/22/98). There are a total of approximately
199,000 miles of streambank and shoreline in the
Bay watershed.
Through August, 2005 Source Chesapeake Bay
Program Office.
12
Chesapeake Bay Watershed Preserved Lands
Year 2010 Goal (6.9 million)
GOAL Permanently preserve from development 20
of the land area in the watershed by
2010. STATUS Between July 2000 and July 2005,
600,843 acres of land were preserved in the
watershed portions of MD, PA, VA and DC. The
total land area preserved is currently estimated
at 6.7 million acres. In order to achieve the
goal, an additional 213,417 acres need to be
preserved.
Source Chesapeake Bay Program Note Baseline
established using 2000 MD, VA DC data and 2001
PA data.
13
Brownfields Redevelopment inChesapeake Bay Basin
Brownfield Sites Ready for Redevelopment
GOAL By 2010, rehabilitate and restore 1,050
brownfield sites to productive use. STATUS One
hundred and eighteen brownfield sites were
cleaned and made ready for redevelopment between
July 2004 and June 2005. This brings the current
total up to 532. In order to achieve the goal we
need 518 more by 2010.
Goal 1,050 by 2010
532
414
284
173
86
Source MD, PA and VA Voluntary Cleanup Programs.
14
Watershed Management Plans
- GOAL By 2010, develop and implement locally
supported watershed management plans in
two-thirds of the Bay watershed. The plans need
to - Address the protection, conservation and
restoration of stream corridors, riparian forest
buffers and wetlands - Reflect the goals and objectives of improving
habitat and water quality - Identify implementation mechanisms
- Have demonstrated local support.
- STATUS As of December 2005, plans have been
written for 10.7 million acres, achieving 47 of
the long-term goal to develop and implement
watershed management plans on 22.9 million acres
in the Bay watershed portions of MD, PA, VA and
DC.
Percent of Goal Achieved
15
Benthic Community and Habitat Condition
Degraded Benthic Communities/Habitat 2005
GOAL Restore benthic communities and their
habitats. STATUS In 2005, 59 of the benthic
community and habitat in the Bay did not meet
benthic restoration goals.
Mainstem Bay
Major Tidal Tributaries
Source Chesapeake Bay Program
16
River Flow into Chesapeake Bay
Source USGS, Baltimore, MD.The Annual Mean
River Flow estimates the flow from all of the
Bay's rivers.
17
Secchi Depth in the Mainstem Bay and Tidal
TributariesStatus and Trends(surface water,
SAV growing season)
Secchi depth is the depth to which light
penetrates the water column and is a measure of
water clarity. Plants require light and,
therefore, water clarity is particularly critical
to submerged aquatic vegetation (SAV), a vital
link to living resources in Chesapeake Bay. Areas
with significant trends between 1985-2004 are
depicted in the map as improving (green outlined
diamond) or degrading (red centered
diamond). Status is currently judged by whether
Secchi depth over the last three years meets the
light requirement for SAV 0.7-1.0 m, depending
on salinity zone. Areas meeting the requirement
are depicted in yellow. Areas that do not meet
the requirement are borderline (light orange) or
failing (orange).
18
Chlorophyll a in the Mainstem Bay and Tidal
Tributaries Status and Trends(surface water,
SAV growing season)
Chlorophyll is an estimate of algal biomass.
Algae are important in the food chain, they are a
factor in water clarity, and they are
first-responders to nutrient level
changes. Areas with significant trends between
1985-2004 are depicted in the map as improving
(green outlined diamond) or degrading (red
centered diamond). Status (2001-2004) is
currently assessed according to the limit(15
µg/L) for submerged aquatic vegetation (SAV).
Areas below this limit meet SAV habitat
requirements and are depicted in yellow. Areas
at or above this limit are borderline (light
orange) or failing (orange).
19
Chesapeake Bay Watershed Population
Source Chesapeake Bay Program Office Data
Center.
20
Municipal Wastewater Flow and Population
Municipal wastewater treatment protects human and
Bay health by providing improved treatment, which
may include advanced treatment for nutrient
removal. The sharper rate of increase in
municipal wastewater flow before 1980 resulted
from the Clean Water Act Construction Grant
Program.
projected
Source Data used in chart are from all
municipal facilities in the Chesapeake Bay
Program Office Point Source Data Base, 1/05.
Data through 2003 are reported tributary
strategy loads are projections.
21
Municipal Wastewater Flow and Municipal
Phosphorus Discharges
Phosphorus discharges from municipal wastewater
treatment facilities have steadily declined since
1970, when the Clean Water Act became
law. Discharges decreased 53 between 1985 and
2003 as a result of improved treatment capability
and implementation of phosphate detergent
bans. An additional 37.5 reduction is expected
upon implementation of tributary strategies due
to increasing nutrient reduction technology (NRT)
implementation. If no further actions are taken,
we anticipate increased discharges in the future
due to population growth.
projected
Source Data used in chart are from all
municipal facilities in the Chesapeake Bay
Program Office Point Source Data Base, 1/05.
Data through 2003 are reported tributary
strategy loads are projections.
22
Municipal Wastewater Flow and MunicipalNitrogen
Discharges
A 15 reduction in discharge loads was achieved
between 1985 and 2003, in spite of a 19.7
increase in population during the same time. An
additional 36.5 reduction is expected upon
implementation of tributary strategies due to
increasing nutrient reduction technology (NRT)
implementation. If no further actions are taken,
we anticipate increased discharges after 2010 due
to population growth.
projected
Source Data used in chart are from all
municipal facilities in the Chesapeake Bay
Program Office Point Source Data Base, 1/05.
Data through 2003 are reported tributary
strategy loads are projections.
23
Municipal Phosphorus Discharge and Population
A 53 reduction in discharge loads was achieved
between 1985 and 2003, in spite of a 19.7
increase in population during the same time. An
additional 37.5 reduction is expected upon
implementation of tributary strategies due to
increasing nutrient reduction technology (NRT)
implementation. If no further actions are taken,
we anticipate increased discharges in the future
due to population growth.
projected
Source Population estimates from the Chesapeake
Bay Program Office Data Center. Discharge data
used in chart are from all municipal facilities
in the Chesapeake Bay Program Office Point Source
Data Base, 1/05. Data through 2003 are reported
tributary strategy loads are projections.
24
Municipal Nitrogen Discharge and Population
A 15 reduction in discharge loads was achieved
between 1985 and 2003, in spite of a 19.7
increase in population during the same time. An
additional 36.5 reduction is expected upon
implementation of tributary strategies due to
increasing nutrient reduction technology (NRT)
implementation. If no further actions are taken,
we anticipate increased discharges after 2010 due
to population growth.
projected
Source Population estimates from the Chesapeake
Bay Program Office Data Center. Discharge data
used in chart are from all municipal facilities
in the Chesapeake Bay Program Office Point Source
Data Base, 1/05. Data through 2003 are reported
tributary strategy loads are projections.
25
Municipal Phosphorus Delivered Loadsand
Population
A 56 (4.5 million lbs/yr) reduction in delivered
loads was achieved between 1985 and 2003, in
spite of a 19.7 increase in population during
the same time. An additional 30 (1 million
lbs/yr) reduction is expected upon implementation
of tributary strategies due to increasing
nutrient reduction technology (NRT)
implementation. The 2003 increase in municipal
loads is due in part to record flow delivered to
municipal facilities for treatment. If no further
actions are taken, we anticipate increased loads
in the future due to population growth.
projected
Source Population estimates from the Chesapeake
Bay Program Office Data Center. Load data used in
chart are from all municipal facilities in the
Chesapeake Bay Program Office Point Source Data
Base, 1/05. Data through 2003 are reported
tributary strategy loads are projections.
26
Municipal Nitrogen Delivered Loads and Population
A 16 (10.8 million lbs/yr) reduction in
delivered loads was achieved between 1985 and
2003, in spite of a 19.7 increase in population
during the same time. An additional 36 (19.8
million lbs/yr) reduction is expected upon
implementation of tributary strategies due to
increasing nutrient reduction technology (NRT)
implementation. The 2003 increase in municipal
loads is due in part to record flow delivered to
municipal facilities for treatment. If no further
actions are taken, we anticipate increased loads
in the future due to population growth.
projected
Source Population estimates from the Chesapeake
Bay Program Office Data Center. Load data used in
chart are from all municipal facilities in the
Chesapeake Bay Program Office Point Source Data
Base, 1/05. Data through 2003 are reported
tributary strategy loads are projections.
27
Chesapeake Basin Sewage Disposaland Septic
System Loads
Method of Household Sewage Disposal in 1990
The benefits of nitrogen (N) load reduction from
investments in new technologies at public sewer
facilities will not be maximized if use of septic
systems increases. N loads from septic systems
are expected to increase as population increases.
These projected loads may be even higher if the
percentage of people using septic systems
increases relative to those using public
sewer. Traditional septic systems do not remove N
from their discharge. Alternative systems have
been designed to remove N, but they are expensive.
Basinwide Nitrogen Loadings from Septic Systems
Source Method of Sewage Disposal CBPO Data
Center using U.S. Bureau of the Census data,
1990. Source Nitrogen Loadings from Septic
Systems CBP Phase IV Watershed Model. The
model estimates that 340 mlb of nitrogen would be
delivered to the Bay during an average hydrology
year assuming 1985 conditions. Of that load it
is estimated that 10 mlb would be delivered
through the groundwater from septic systems.
28
Chesapeake Bay Partner Communities
GOAL Recognize 165 (10) of the local
governments in the Chesapeake Bay watershed as
Bay Partner Communities by the year 2000, and 330
(20) by the year 2005. STATUS 2 new local
governments were awarded Bay Partner Community
Status in 2005 and 14 previous award winners
recertified. Currently, there are 72 Bay Partner
Communities.
Year 2005 Goal (330)
Year 2000 Goal (165)
Source Chesapeake Bay Program Note No awards
made in 2001 and 2002 while the BPC program was
reorganized to reflect the new agreement,
Chesapeake 2000.
CHESAPEAKE BAY PARTNER COMMUNITIES
29
Chesapeake Bay Partner CommunitiesAward Status
GOAL Encourage 20 of the Bay Partner
Communities recognized by 2000, to achieve a
higher tier by the year 2005. STATUS Of the 72
local governments awarded Bay Partner Community
status between 1997 and 2005, 16 achieved bronze,
19 achieved silver and 37 achieved gold status.
During this time, 16 achieved a higher tier and 9
previous award winners recertified at the same
tier.
Year 2005 Goal (330)
Year 2000 Goal (165)
Source Chesapeake Bay Program Note No awards
made in 2001 and 2002 while the BPC program was
reorganized to reflect the new agreement,
Chesapeake 2000.
CHESAPEAKE BAY PARTNER COMMUNITIES
30
Bay Watershed Residents SurveyLevel of Concern
and Attitudes
Key findings of A Survey of Chesapeake Bay
Watershed Residents Knowledge, Attitudes and
Behaviors Towards Chesapeake Bay Watershed Water
Quality Issues, 2002
- 94 believe that restoring waterways in the Bay
region is important. - 89 are concerned about pollution in the Bay.
- 85 are concerned about pollution in their local
waterways. - 49 believe the current restoration efforts are
too little 2 believe they are too much.
Source A Survey of Knowledge, Attitudes and
Behaviors Towards Chesapeake Bay Watershed Water
Quality Issues. Chesapeake Bay Program, 2002.
31
Bay Watershed Residents SurveyBehaviors and
Attitudes
Key findings of A Survey of Chesapeake Bay
Watershed Residents Knowledge, Attitudes and
Behaviors Towards Chesapeake Bay Watershed Water
Quality Issues, 2002
- 51 said they knew how to become involved in
water quality improvement actions. - 86 said they would likely become involved in
improving water quality if they believed their
actions would make a difference. - 87 believe one persons actions can make a
difference in improving water quality, but only
53 believe that their everyday actions adversely
affect water quality.
Source A Survey of Knowledge, Attitudes and
Behaviors Towards Chesapeake Bay Watershed Water
Quality Issues. Chesapeake Bay Program, 2002.
32
Knowledge of Bay Watershed Residents
- Overall, 48 of Bay watershed respondents
correctly identified the definition of
watershed from four options.
- Comparatively, national polls showed that 40 of
people answered correctly.
Source A Survey of Knowledge, Attitudes and
Behaviors Towards Chesapeake Bay Watershed Water
Quality Issues. Chesapeake Bay Program, 2002.
33
Perceptions of Bay Watershed ResidentsWater
Quality
- ? How concerned are you with the quality of local
streams and waterways? Chesapeake Bay as a whole?
Source A Survey of Knowledge, Attitudes and
Behaviors Towards Chesapeake Bay Watershed Water
Quality Issues. Chesapeake Bay Program, 2002.
34
Perceptions of Bay Watershed ResidentsPollution
- ? How concerned are you about pollution in the
Bay?
? Compared to 10 years ago, the Bay is
Source A Survey of Knowledge, Attitudes and
Behaviors Towards Chesapeake Bay Watershed Water
Quality Issues. Chesapeake Bay Program, 2002.
35
Attitudes of Bay Watershed ResidentsCauses of
Pollution
- ? How much impact does each have?
No Impact
Great Impact
Source A Survey of Knowledge, Attitudes and
Behaviors Towards Chesapeake Bay Watershed Water
Quality Issues. Chesapeake Bay Program, 2002.
36
Attitudes of Bay Watershed ResidentsImpact of
Pollution Sources
- ? How much impact does each have?
Greatest
Least
Source A Survey of Knowledge, Attitudes and
Behaviors Towards Chesapeake Bay Watershed Water
Quality Issues. Chesapeake Bay Program, 2002.
37
Behaviors of Bay Watershed Residents
- ? How likely would you be to become more involved
if
Source A Survey of Knowledge, Attitudes and
Behaviors Towards Chesapeake Bay Watershed Water
Quality Issues. Chesapeake Bay Program, 2002.
38
Bernie Fowler's "Sneaker Index"
GOAL Restore Bernie's sneaker visibility to
chest depth (57 to 63 inches). STATUS Wading in
the Patuxent River at Broomes Island, MD, Bernie
has seen improvements in water clarity since
1988. He says, "although this is not a
scientific measure, it puts restoring the river
on a human scale."
Source Former Maryland state senator C. Bernard
Fowler
Recommended
CrystalGraphics Presentations


