
Variability of Sea Ice in West Greenland - PowerPoint PPT Presentation
Title:
Variability of Sea Ice in West Greenland
Description:
A major part of the West Greenland ecosystem is covered with sea ice for about half the year. ... Correlations are moderately positive in West Greenland. ... – PowerPoint PPT presentation
Number of Views:90
Avg rating:3.0/5.0
Title: Variability of Sea Ice in West Greenland
1
Variability of Sea Ice in West Greenland
Presented at the Workshop on Sea Ice Extent and
the Global Climate System, 15-17 April 2002,
Toulouse, France
A major part of the West Greenland ecosystem is
covered with sea ice for about half the year.
This skin of sea ice, called the West Ice,
seasonally prevents fishing activities and is an
important habitat for numerous birds and sea
mammals and a variety of ice-associated
biological activity. Parkinson et al. 1 found
a trend in the wintertime sea ice extent of 7.5
per decade for 1978-1996 for the region
encompassing Baffin Bay, Davis Strait, and the
Labrador Sea. The wintertime surface air
temperature shows a trend of -2oC per decade for
1979-1997 along the west coast of Greenland north
of 69oN 2. These regional changes in ice
extent and temperature are linked to the North
Atlantic Oscillation (NAO) - the difference in
surface atmospheric pressure between Portugal and
Iceland 3. We examine the sea ice area in
March in three overlapping study regions centered
at 69oN on the west coast of Greenland (Figure
1). The objectives are to estimate the trends in
the ice cover as far back in time as possible,
and to develop guidelines for a future annual
assessment of the ice conditions in West
Greenland. Satellite data. We use monthly
gridded sea ice concentration derived from the
Scanning Multichannel Microwave Radiometer (SMMR,
1978-1987) and the Special Sensor Microwave
Imager (SSMI, 1987-present). Figure 2 shows an
example for March 1996. Chart data. From 1952
to 1980 the Danish Meteorological Institute
published an annual volume called "The Ice
Conditions in the Greenland Waters". Each volume
contains maps of the ice concentration at the end
of each month, as in Figure 3. Data for the
charts came from ship and aircraft observations.
We scanned the charts, digitized the contours,
and computed the area of ice within each study
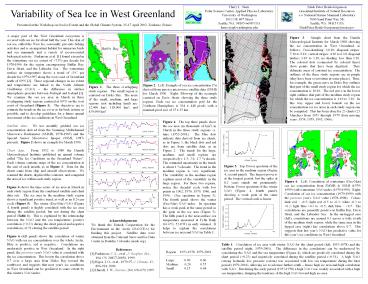
region. Figure 4 shows the time series of ice
area in March in each study region from the
combined satellite and chart data sets. The ice
area in the medium study region shows a
significant positive trend, as well as an
8.2-year cycle (Figure 5). The winter (Dec-Mar)
NAO (Figure 4, fourth panel) is highly correlated
with the ice area during the satellite period,
but not during the chart period (Table 1). This
is explained by the relationship between the NAO
and the sea temperature positive correlation
(0.23) during the chart period and negative
correlation (-0.51) during the satellite
period. Figure 6 (left panel) shows the
correlation of winter NAO with sea ice
concentration over the whole Arctic. Blue is
positive, red is negative. Correlations are
moderately positive in West Greenland. In the
right panel, the previous year's NAO value is
correlated with the ice concentration. This
boosts the correlation above 0.7 over a large
area from Disko Bay toward the southwest, and
suggests that next year's ice conditions in West
Greenland can be predicted to some extent by this
winter's NAO index.
Figure 4. The top three panels show the ice area
(in thousands of km2) in March in the three study
regions vs. time (1952-2001). The blue dots
indicate data derived from ice charts, as in
Figure 3 the black dots and red dots are from
satellite data, as in Figure 2. The trends for
the large, medium, and small regions are
(respectively) 1.5, 3.0, 1.7 /decade. The
estimated uncertainty in the trends is about 1
/decade. The trend in the medium region is very
significant. The variability in the medium
region explains most of the variability in the
large region. For those two regions, notice the
decadal cycle with low points in 1962, 1970,
1979, 1986, and 1996. (See spectrum in Figure
5). The fourth panel shows the winter (Dec-Mar)
NAO index. Its spectrum has a weak peak at the
same period as the peak in the ice area (Figure
5). The fifth panel is the near-surface sea
temperature measured at Fylla Bank (63.6oN,
52.4oW) in early summer. It helps to explain the
correlations between ice area and NAO in Table 1.
Acknowledgements We thank the Danish Cooperation
for the Environment in the Arctic (DANCEA) for
funding this project. Satellite data were
obtained from the National Snow and Ice Data
Center in Boulder, Colorado (nsidc.org).
References 1 Parkinson, C. L., et al., J.
Geophys. Res., 104, C9, 20837-20856, 1999. 2
Rigor, I. G., et al., 1979-97, J. Climate, 13,
896-914, 2000. 3 Hurrell, J. W., Science, 269,
676-679, 1995.
Recommended
CrystalGraphics Presentations


