
USGSNOAA Workshop to Develop a Coastal Climate Initiative - PowerPoint PPT Presentation
1 / 14
Title:
USGSNOAA Workshop to Develop a Coastal Climate Initiative
Description:
USGS-NOAA Workshop to Develop a Coastal Climate Initiative ... Coastal Risk Atlas - NOAA National Coastal Data Development Center ... – PowerPoint PPT presentation
Number of Views:70
Avg rating:3.0/5.0
Title: USGSNOAA Workshop to Develop a Coastal Climate Initiative
1
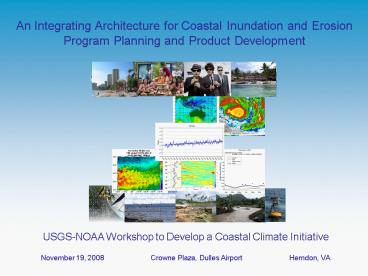
An Integrating Architecture for Coastal
Inundation and Erosion Program Planning and
Product Development
USGS-NOAA Workshop to Develop a Coastal Climate
Initiative November 19, 2008
Crowne Plaza, Dulles Airport
Herndon, VA
2
Why Coastal Inundation and Erosion?
- Approximately 50 percent of the U.S. population
lives within 50 miles of the coast, 19 of the 20
most densely populated counties are coastal
counties and 10 of the 15 most populous cities
are located within these counties. - For communities located close to the sea,
coastal inundation and erosion are among the most
serious and costly of risks. - Coastal inundation and erosion-related risks go
beyond extreme episodic storm-related events to
include chronic, longer-range risks linked to
rising sea levels and a changing climate. For
example, the U.S. Government Accounting Office
(2003) estimates that as sea ice melts and
inundation and erosion along the coast of Alaska
becomes significant, it will cost over 1 billion
dollars to relocate native villages. - The vulnerability to inundation and
erosion-related risks is not just a function of
being in harms way. The population of U.S.
coastal counties has risen by 33 million since
1980. This rate has been increasing
exponentially in the latter half of the 20th
century and into the 21st century.
- The 2008 hurricane season is the second most
destructive season on record, with up to 52
billion in damage. - In 2005, Hurricane Katrina was directly
responsible for over 1000 deaths along the U.S.
Gulf of Mexico coast and was the largest single
environmentally caused economic catastrophe to
affect the United States. Direct economic losses
are estimated to exceed 100 billion dollars
3
Overview
The integrating architecture defines the
various components of the problem. It emphasizes
the importance of focusing on the linkages
required to seamlessly integrate the various
pieces of the puzzle in a way that addresses
local, regional and national needs, and that
forms a basis for developing comprehensive and
decision-support-oriented programs of research,
products, and services.
- The integrating architecture is designed to
- Provide a more comprehensive, integrated view of
the physical and social systems that enables the
unique information requirements of users to be
better articulated. - Promote a broader, shared understanding between
and among scientists and decision-makers of the
nature of the problems and needs by placing an
emphasis on user requirements. - Bridge gaps and eliminate overlaps through the
end- to end mapping of various niches and
networks, such that different agencies,
institutions, and organizations are better able
to understand where they can best fit and
contribute. - Enhance access to and use of information by
providing a structure to support the discovery
and packaging of this information.
4
Factors Affecting Risk
The processes responsible for coastal inundation
and erosion are complex and varied, operating
across a range of scales in time and space. They
tend to be expressed in combinations that are
unique to a given setting and are changing
because of a changing climate.
5
Factors Affecting Resilience
The potential users of information and their
respective needs are diverse in terms of content,
format, and timing. Like the physical systems,
the social systems are in flux as growing
populations along the coast result in changing
community conditions.
6
Coastal Inundation and Erosion Integrating
Architecture
PHENOMENA
TSUNAMI
FLOODING and EROSION
SEA LEVEL
SEA
AIR
HUMAN FORCES
Factors Affecting Risk
LAND
7
Connections
The connections that must be made to achieve a
truly integrated approach to coastal inundation
and erosion program planning and product
development form an intricate web. Connections
are required vertically, from problems to
solutions, and users to providers. Connections
are required horizontally, across agencies and
disciplines, and public and private sectors.
The world thus appears as a complicated tissue of
events, in which connections of different kinds
alternate or overlap or combine, and thereby
determine the texture of the whole. Werner von
Heisenberg
8
The Way Forward
9
Thank you!
10
PRODUCTS HINDCASTS historical perspectives NOWC
AST warnings and bulletins FORECAST daily,
weekly, monthly, seasonal outlook FUTURECAST sc
enarios and projections
- Sea Levels Online - NOAA Center for Operational
Oceanographic Products and Services (COOPS) - Historical Rainfall and Streamflow -
U.S. Geological Survey Pacific Islands Water
Science Center - U.S. Global Historical Climate Network (USHCN,
GHCN)- NOAA National Climatic Data Center (NCDC) - Pacific Region Integrated Climatology
Information Products (PRICIP) - NOAA NCDC - Wave Information Studies (WIS) - U.S. Army Corps
of Engineers - Current Active Coastal Watches and Warnings -
NOAA National Weather Service - Physical Oceanographic Real-Time System (PORTS)
- NOAA COOPS - NOWCOAST - Web mapping portal - NOAA Coast
Survey Development Laboratory - Oregon Coastal Inundation Visualization Tool -
NOAA Coastal Services Center (CSC) - Realtime Rainfall and Streamflow -
U.S. Geological Survey Pacific Islands Water
Science Center - Tropical Cyclone, Marine, and Aviation Forecasts
- NOAA National Weather Service - National Digital Forecast Database (NDFD) - NOAA
National Weather Service - Tides Online, Operational Forecast System (OFS)
- NOAA COOPS - Pacific ENSO Update - NOAA National Weather
Service - US Seasonal and Climate Outlooks - NOAA National
Weather Service - Hurricane Evacuation Zone Maps - NOAA CSC and
Federal Emergency Management Agency
11
MODELS
- TOPEX/Poseidon Tide Height Model - National
Aeronautics and Space Administration (NASA), and
others - Global Wave Model (GWAM) - U.S. Navy
- WAVEWATCH III - NOAA National Weather Service
(NWS), National Center for Atmospheric Research
(NCAR) , NASA, and others - Sea, Lake, and Overland Surges from Hurricanes
(SLOSH) - 2D - NOAA NWS, Federal Emergency
Management Agency, and U.S. Army Corps of
Engineers - Advanced Circulation Model (ADCIRC) -
Environmental Modeling Systems Inc., National
Operational Coastal Modeling Program - Simulating WAves Nearshore (SWAN) - U.S. Army
Corps of Engineers and U.S. Navy - Coastal Engineering Design and Analysis System
(CEDAS) - U.S. Army Corps of Engineers - National Operational Coastal Modeling Program -
NOAA COOPS - NCEP Climate Forecast System - NOAA National
Weather Service - Climate Visualization (CLIMVIS) - NOAA National
Climatic Data Center - WRF model and Hurricane WRF - NOAA National
Weather Service - Atmospheric-Oceanic Global Climate Models
(AOGCMs) - NCAR, NASA, and others
12
- Tide Gauges National Water Level Observation
Network (NWLON) - NOAA Center for Operational
Oceanographic Products and Services - Wave Buoys Moored and C-MAN Buoy Network -
NOAA National Data Buoy Center - Wave Buoys CDIP Buoy Network - U.S. Army Corps
of Engineers (USACoE) - Satellites TOPEX/POSEIDON and Jason-1 -
National Aeronautics and Space Administration
(NASA) - Satellites ORAD Laboratory for Satellite
Altimetry (LSA) - NOAA National Environmental
Satellite, Data, and - I Information Service
- Radar HF Radar
- Video Argus Video Monitoring Stations - Video
Metric Systems - Weather Stations Automated Surface Observing
System (ASOS) - NOAA National Climatic Data
Center - Ocean Buoys TAO/TRITON buoy array - NOAA
Pacific Marine Environmental Laboratory - Coastal Buoys National Water Level Observation
Network (NWLON) - NOAA Center for Operational
Oceanographic Products and Services - Rainfall and Stream Gauges - U.S. Geologic
Survey (USGS) - Satellites ERS-1 and -2, ADEOS II NSCAT,
QuikSCAT and SeaWinds Platforms - NASA - Satellites CoastWatch- NOAA National
Environmental Satellite, Data, and Information
Service - Radar National Severe Storms Lab (NSSL)
rainfall - NOAA National Weather Service
SYSTEMS and DATA Waves and Water
Level Meteorology Topography,
Bathymetry, and Geology
13
Water Level Process Spectrum
10 m 1 m 10 cm 1 cm
MAGNITUDE
tides
waves
storms/surge
20 years
200 years
2 days
2 years
2 hours
2 weeks
20,000 years
2,000 years
2 months
FREQUENCY
14
Use Sector Product Spectrum
Elected Officials and the General Public
Tailored Products
Applied Products
LEVEL OF PRODUCT DEVELOPMENT
Derived Products
Scientific and Technical Community
HINDCAST historical perspectives
NOWCAST warnings and bulletins
FORECAST weekly, monthly, seasonal outlook
FUTURECAST scenarios and projections
20 years
200 years
2 days
0
2 hours
2 weeks
2 years
2 months
2 minutes
TIME FRAME OF APPLICABILITY
Recommended
CrystalGraphics Presentations


