
Multiple linear regression - PowerPoint PPT Presentation
1 / 10
Title:
Multiple linear regression
Description:
... age (x1 in years), severity of illness (x2 index), and anxiety level (x3 index) ... Test if b1 -1 with 90 confidence. H0: b1 = -1, H1: b1 -1. tobs ~ t43 ... – PowerPoint PPT presentation
Number of Views:63
Avg rating:3.0/5.0
Title: Multiple linear regression
1
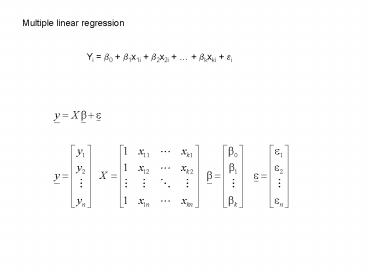
Multiple linear regression
Yi b0 b1x1i b2x2i bkxki ei
2
Take STA463 for details
3
A hospital administrator wished to study the
relation between patient satisfaction (Y) and a
persons age (x1 in years), severity of illness
(x2 index), and anxiety level (x3 index). The
administrator randomly selected 46 patients with
the following results.
4
(No Transcript)
5
Suppose a patient is 62 years old and has an
anxiety index of 86. What is their predicted
satisfaction index?
What proportion of the variability in
satisfaction can be accounted for by the model?
r2 66.10
6
95 CI for b3 b3 tdfe,a/2 se(b3) -16.74205
2.042(6.08083) (-29.1591, -4.3250)
- Test if b1 lt -1 with 90 confidence
- H0 b1 -1, H1 b1 lt -1
- tobs t43 if H0 is true
- Reject H0 if p-value lt 0.10
- tobs (b1 b1)/se(b1) (-1.20047
(-1))/0.20411 -0.98217 - p-value 0.1658 (from Excel)
- Fail to reject H0
- With 90 confidence there is insufficient
evidence to conclude that the b1 is less than -1
7
- Do any of the variables regressor variables
(xs) significantly explain variability in the
dependent (Y) variable at the 0.05 level of
significance? - H0 b1 b3 0, H1 at least of the bs do not
equal 0 - Fobs F2,43 if H0 is true
- Reject if p-value lt 0.05
- Fobs 44.88 (SAS output)
- p-value lt 0.0001 (SAS output)
- Reject H0
- With 95 confidence there is sufficient evidence
that at least one of b1 and b3 do not equal 0.
The F table (for critical values) pages 757 760
in your book
8
page 453 12.7. An experiment was conducted in
order to determine if cerebral blood flow in
human beings can be predicted from arterial
oxygen tension (mm of Hg).
9
(No Transcript)
10
(No Transcript)
Recommended
CrystalGraphics Presentations


