
Climate Variability Short and Long Term - PowerPoint PPT Presentation
1 / 24
Title:
Climate Variability Short and Long Term
Description:
Global radiosonde network. A GOES Geostationary Satellite. Cloud monitoring. from satellite. Radiosonde balloon. launch. Macquarie Island. Seasonal climatic variations ... – PowerPoint PPT presentation
Number of Views:57
Avg rating:3.0/5.0
Title: Climate Variability Short and Long Term
1
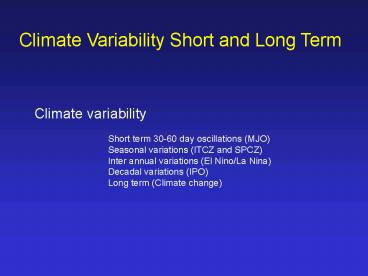
Climate Variability Short and Long Term
Climate variability Short term 30-60 day
oscillations (MJO) Seasonal variations (ITCZ
and SPCZ) Inter annual variations (El Nino/La
Nina) Decadal variations (IPO) Long term
(Climate change)
2
Type of climate phenomena Frequency
(years) Madden Julian Oscillation 0.1 -
0.2 Seasons 1 El Nino / La Nina 0.5 -
7 Quasi biennial oscillations (NAO) 1-2 Antarcti
c circumpolar wave 3-5 Latitude of the
STR 1-11 Inter-decadal Pacific Oscillation
(IPO) 13 Decadal Pacific Oscillation
(DPO) 13-18 Multi-decadal rainfall
variability 18-39 Inter-hemispheric thermal
contrast 50-80 Climate change 1000
3
The Madden - Julian Oscillation (MJO) 30 to 60
day oscillation 30 to 60 day wave Intra
seasonal oscillation
4
What is the MJO?
A progression of large regions of both
enhanced and suppressed tropical rainfall that
moves from west to east mainly over the Indian
and Pacific Oceans. A naturally occurring
component of the coupled ocean atmosphere system
5
MJO - The area of anomalous rainfall (either
enhanced or suppressed) is first evident over the
western Indian Ocean Remains intact across the
western and central tropical Pacific Usually
weakens over cooler waters of eastern Pacific
Reappears over western Indian ocean Each cycle
lasts about 30 to 60 days
6
The MJO
7
Varies strongly from year to year - long
periods of strong activity - periods of weak
activity - stronger MJO activity when SSTs are
near normal or slightly above average across
the western Pacific - weak activity when SSTs
are well above average across the eastern
Pacific
8
Predicting the Development and movement of the
MJO Weather satellite detection of tropical
cloud development and movement Global
radiosonde network
9
A GOES Geostationary Satellite
10
Cloud monitoring from satellite
11
Radiosonde balloon launch Macquarie Island
12
Seasonal climatic variations
The Inter Tropical Convergence Zone (ITCZ) South
Pacific Convergence Zone (SPCZ)
13
The Inter Tropical Convergence Zone (ITCZ)
14
The Climate of Suva
15
Climate of Kampala, Uganda, Africa
16
The ITCZ (also called the Equatorial trough)
A zone of convergence of the trade winds
Moves north and south with the seasons
Associated with a peak in rainfall activity
Sometimes ill defined Can have ragged edges or
spurs
17
July
January
Average positions of the ITCZ during July and
January
18
The South Pacific Convergence Zone (SPCZ)
The largest and most persistent spur of the
ITCZ A band of low level convergence about 200
to 400 km wide Stretches from the Solomon
Islands to Fiji, Samoa and Tonga and weakens
further to the south-east. Associated with SST
maxima, cloudiness and precipitation. Is
present year round but most active in the SH
summer
19
Mean rainfall rate for January 1968-1996
20
Mean rainfall rate for July 1968-1996
21
The SPCZ Moves north with the ITCZ in SH
winter It moves NE when SSTs are above
average in the eastern Pacific It moves SW
when SSTs are above average in the western
Pacific
22
1977 - A Watershed Year In 1977 the SPCZ
appeared to move east by about 150 km Caused
drier weather in Fiji, Tonga, Vanuatu and New
Caledonia Wetter conditions in the northern
Cook Islands and Tokelau (30 increase in rain
since 1977)
23
The Inter- Decadal Pacific Oscillation (IPO)
Pacific SSTs vary on decadal timescales in a
similar fashion to the way they vary from year
to year with ENSO. There are periods of the
order of a decade where the Pacific Ocean
temperatures are more El Nino like and periods
when they are more La Nina like. These
fluctuations have been called the IPO.
24
When the IPO is negative, the Pacific Ocean is
in a La Nina like phase, with enhanced
rainfall following over much of the western
Pacific. (eg eastern Australia in the
1950s) When positive, the Pacific Ocean is more
El Nino like with droughts more common in the
western Pacific Also, it appears that when the
IPO is negative, the SOI climate relationships
are stronger than when the IPO is positive -
affects the probability of our seasonal
ENSO based forecasts
Recommended
CrystalGraphics Presentations


