
Linkage in human families is determined by LOD score analysis - PowerPoint PPT Presentation
1 / 47
Title:
Linkage in human families is determined by LOD score analysis
Description:
Linkage in human families is determined by LOD score analysis. A LOD score is defined as the ... l = trait in relatives of proband/ trait in the population ... – PowerPoint PPT presentation
Number of Views:678
Avg rating:3.0/5.0
Title: Linkage in human families is determined by LOD score analysis
1
Linkage in human families is determined by LOD
score analysis
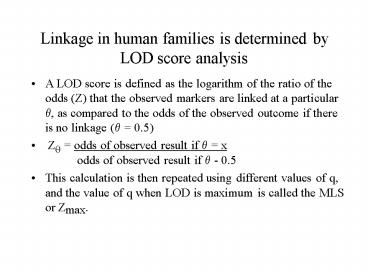
- A LOD score is defined as the logarithm of the
ratio of the odds (Z) that the observed markers
are linked at a particular q, as compared to the
odds of the observed outcome if there is no
linkage (q 0.5) - Zq odds of observed result if q x
odds of observed
result if q - 0.5 - This calculation is then repeated using different
values of q, and the value of q when LOD is
maximum is called the MLS or Zmax.
2
Scoring recombinants
- A1,A2 A3,A4
- B1,B2 B3,B4
- A1,A3 A2,A3 A1,A4 A2,A4 A2,A3 A1,A4
- B2,B3 B1,B3 B2,B4 B2,B4 B1,B4 B2,B4
- Each parent makes 6 germ cells of which 1 is
recombinant what is the map distance? - 1/6 .167 16.7 cm apart
3
- To go back to the example we had before
- For each parent 1/6 gametes is recombinant
- The overall likelihood, given linkage, is (1-
q?r?qnr - The overall odds of nonlinkage (q 0.5) is (0.5)6
0.015625 - At q 0.1, (1- q?5?q 0.95????????????
- Zq0.1 0.59/ 0.015625 3.77
- LODq0.1 0.577
- At q 0.15, Z 4.26 and LOD 0.629
- At q 0.20, Z 4.19 and LOD 0.623
- At q 0.25, Z 3.80 and LOD 0.579
- If there are 3 similar families with this trait,
and the same pattern of segregation, then
LODq0.15 0.629 0.629 0.629 1.887
4
Parameters which must be specified
- Mode of inheritance
- Population frequency of trait
- Population frequency of alleles at tested loci
- Population frequency of phenocopies
5
Mode of inheritance
6
Great! You have a map result!
7
Narrowing down the region
8
Narrowing down the region
9
The Huntingtons disease example
10
The flow of gene discovery
11
(No Transcript)
12
(No Transcript)
13
(No Transcript)
14
Homozygosity mapping
- For rare recessive traits, it is sometimes
possible to map a gene simply by looking at
regions of homozygosity in affected persons - In cases of consanguinity, these persons
presumably inherited both disease and surrounding
alleles from a common ancestor - In genetic isolates (or even in relatively small
gene pools), the same principle applies, though
the extent to which the region has recombined
will be a function of q and of the number of
generations which have elapsed since the putative
mutation arose
15
(No Transcript)
16
Non-parametric Linkage
- Non-parametric linkage methods can be used when
there is some uncertainty about the correct
genetic model, or when extended kindreds are not
available for linkage analysis - Most of these methods are based on the analysis
of allele sharing between affected sibling pairs - The principle underlying this is simply that, if
two first-degree relatives share a trait in
common (eg., diabetes), then it follows that they
will likely share allelotypes of other genetic
markers in close proximity to the gene which
confers the risk for diabetes
17
NPL, continued
- If these are markers which are readily scored
(eg., STR, SNP), then it may be possible to map
the trait for further genetic analysis - This method can also be extended to other classes
of 1 or 2 relatives, but it then becomes
imperative to distinguish IBD from IBS - A disadvantage of NPL is that statistical power
of the method is severely reduced, as compared to
the LOD score method
18
Terminology reminder
- Identity by descent a pair of sibs (or other
relatives) inherit a given allele from the same
parent - Identity by state a pair of relatives have the
same allele, but you cant tell whether it came
from the same parent
19
Allele sharing
- Consider a mating which is fully informative
- A1/A2 x A3/A4
- There are three possible outcomes for two
offspring with respect to alleles in common - 2 alleles shared 1 allele shared 0
alleles shared - Eg A1/A3 A1/A3 A1/A3 A1/A4 A1/A3A2/A4
- The probability of these outcomes in the
illustrated pedigree are 1/4 (2 shared), 1/2 (one
shared), 1/4 (no shared alleles), respectively
20
Allele sharing
- The situation becomes more complex if the mating
is not fully informative - A1/A2 x A3p/A3m
- There are now only two outcomes for a given
individual A1/A3 A2/A3 so that all
offspring will share the A3 allele, but it is not
possible (without further genotyping information)
to tell whether siblings have or have not
inherited the same A3 chromosome - If both siblings are A1/A3, the A1 is shared IBD,
but the A3 is only shared IBS
21
Identity by descent
22
Identity by descent or state?
23
As was the case for parametric linkage, part of
this problem can be solved with additional
genotyping
- 26163 51324
- 47564 62345
- 26163 47564 26163 47564
- 51324 62345 62345 51324
- This mating is fully informative for all markers
except the shaded marker, but because the
surrounding markers are all informative, we can
say with reasonable certainty that offspring 1
and 4 share this allele IBD, as do offspring 2
and 3
24
But, haplotype information cant resolve all
questions..
- 26164 51324
- 47564 62345
- 26164 47564 26164 47564
- 51324 62345 62345 51324
- In this pedigree, there are 3 copies of the same
allele at the distal end of the haplotype - Offspring 2 and 3 dont share this allele, but
you cant be certain that individuals 1 and 4
share the same maternal allele IBD, because only
one flanking marker is typed
25
More about allele sharing
- This method can be (and commonly is) used when
parents are not available for genotyping, but
unless enough siblings are available to know that
the mating was fully informative, one can only
conclude that shared alleles are IBS - Eg., if A1/A3, A1/A2, A3/A4 are siblings, then
you could be certain that A1 for the first pair,
and A3 for the second pair, are shared IBD - When using the method for 2 relatives, you must
typically be able to genotype the entire kindred
in order to claim IBD - Caution IBS reduces information by a factor of
2
26
Sib Pair analysis (Haseman-Elston)
- Underlying principle if a genetically
influenced trait is present in two siblings or 1
relatives, then it is likely that they will also
share genetic markers which are physically close
to the disease allele more frequently than
expected by chance - On average, chance sharing of 1 allele IBD is
50, so what you are looking for is gt50 sharing
of the trait and marker alleles. For most
traits, this requires a sample of 100-300 sibling
pairs, in order to provide statistical power - The classical Elston/Stewart method is a
hypothesis-testing method, in which the H0 is
0.5. The number of cases necessary to achieve
power to reject this hypothesis is proportional
to the genetic relative risk or risk ratio.
27
Sib pair analysis is the basis of NPL
- A simple computerized method of non-parametric
linkage analysis is readily available, as are
multipoint modifications and more statistically
sophisticated methods which take into account
additional sources of variance - Statistical evaluation of the results
- Maximum likelihood, vs simulated p values
- Significant linkage MLS 3.6, p 2 x 10⁻⁵.
Would occur by chance in 1/20 linkage studies - Highly significant MLS 5.4, p 3 x 10⁻⁷.
Would occur by chance 1/1000 genome scans - Confirmed linkage independent replication
28
An example of NPL analysis
29
(No Transcript)
30
What is the genetic relative risk (l)?
- l is an estimate of familial resemblance, not
unlike heritability, but much easier to compute - l trait in relatives of proband/ trait in
the population - For Mendelian traits, l is very large
- Eg., for CF ls 1/4 1/25000 25000/4 625
- For complex traits, l is much smaller (typically,
2 - 100) - One can define a range of l values
- For siblings ls
- For 1 relatives l1
- For 2 relatives l2 etc
31
Dont confuse genetic RR with epidemiological RR
- Relative risk is actually a term which derives
from epidemiology, and refers principally to the
association between a particular risk factor and
the expression of a disease - RR ( risk in trait)( controls without risk)
- ( trait without risk)( risk in controls)
- Eg 95 of persons with ankylosing spondylitis
are HLA-B27, but only 20 of persons with B27
develop AS - RR (0.95.93)/(.05.2) 88
32
Another use of the Haseman-Elston algorithm is to
map quantitative traits
33
Quantitative trait analysis
- The foregoing example uses a quantitative measure
of the trait under investigation (eg., IQ,
height, BP, etc). This trait is measured for
each sibling, then the difference is squared (to
avoid negative numbers) and regressed against the
number of alleles shared at a locus IBD. - A negative regression line is indicative of
linkage between the locus and trait, while a
positive regression line would indicate the
reverse. How about a straight line?
34
Association studies
- A standard epidemiological design in which cases
are compared to controls - An important assumption is that cases and
controls are drawn from the same population - Tested by standard statistical methods (eg., c2)
- Explanations for an observed association
- Population stratification
- Linkage disequilibrium
- The tested allele actually contributes to the risk
35
Transmission disequilibrium test (TDT)
- This is a family-based method of evaluating the
strength of association between a trait and a
polymorphic marker or markers - Consider a family in which an affected parent has
the genotype AB, the unaffected parent is
homozygous for either allele, and there are 2
affected offspring. - The affected parent has an equal probability of
transmitting allele A or allele B to the affected
offspring. - The basic statistical comparison is between the
alleles which ARE transmitted to affected
offspring and those which are NOT.
36
TDT, continued
- The H0 is that equal s of A and B will be
transmitted to affected offspring. - Disequilibrium between the trait and either
allele (significantly more than 50 of either
allele) is indicative of genetic association, and
possibly of linkage. - NPL is a locus-based method, but TDT is a
sensitive to the specific alleles being tested.
It may indicate association between a trait and a
specific allele (eg., AD and ApoE4), but further
testing is required to confirm linkage. - Eg., this particular allele might modify the
expression of a trait, but not be physically
close to the trait gene.
37
cases required for analysis
38
Linkage disequilibrium mapping
- LD occurs when a haplotype occurs more (or less)
often than would be predicted from the
frequencies of the separate alleles - The source of LD is typically a mutation in a
founder, which is gradually eroded at the rate of
1-q per generation. - Conceptually, LD is used as a means of mapping
which treats affected individuals as members of
giant pedigrees which extend over many
generations - Not surprisingly, genetically isolated or
homogeneous populations are favorites for this
type of mapping
39
The principle of LD mapping
40
(No Transcript)
41
LD maps-1
42
LD maps-2
43
An example
44
(No Transcript)
45
(No Transcript)
46
(No Transcript)
47
(No Transcript)
Recommended
CrystalGraphics Presentations


