
Coastal Time Series: Documenting change across the landsea transition zone - PowerPoint PPT Presentation
1 / 53
Title: Coastal Time Series: Documenting change across the landsea transition zone
1
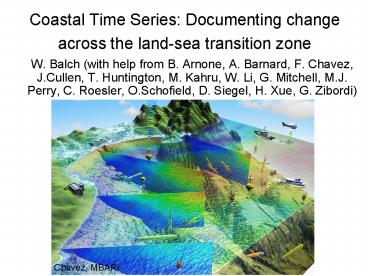
Coastal Time Series Documenting change across
the land-sea transition zone
- W. Balch (with help from B. Arnone, A. Barnard,
F. Chavez, J.Cullen, T. Huntington, M. Kahru, W.
Li, G. Mitchell, M.J. Perry, C. Roesler,
O.Schofield, D. Siegel, H. Xue, G. Zibordi)
Chavez, MBARI
2
Outline
- Importance of coastal zone and challenges to
detect change - Examples of coastal time series and lessons
learned - New technologies available
- Critical Patch Concept revisited
- Recommendations for the future
3
Coastal waters
- Human impact of coastal zone enormous. gt50 of
US population lives on or near coast. - Coastal domain accounts for 25-40 of global
primary production (disproportionate contribution
relative to 11 of ocean area Longurst et al.,
1995) - Hardest domain to define biogeographical
boundaries - Affected by wide array of forcing bathymetry,
river input, tidal fronts, tidal mixing, extreme
wind stress, downwelling and upwelling features
(along shelf break and coasts), etc. - Coastal domain poorly known if net CO2 source or
sink
4
Challenges in Coastal Time Series
- Land effects are profound
- Case II optical properties complicate remote
sensing - Spatial gradients are high
- Problem for monitoring at single sitealiasing
- Must use array of stations or transect time
series - Huge temporal and spatial variance in properties
relative to central oceansthis makes it harder
to define significant change
5
Land connections are key in a coastal time
series! NASA-Interdisciplinary Science (Balch,
Aiken, Barnard, Huntington, Roesler, Xue)
Research Problem Optically-active colored
dissolved organic matter (CDOM) influenced by its
terrestrial origins. Defining spatial and
temporal variability in GoM requires
understanding CDOM export
Study Area Penobscot Watershed, River, Bay and
Gulf of Maine
Objective Estimate daily DOC flux from the
Penobscot River and its tributaries,
transformations in river and bay, fate in GoM,
modeling of DOC export and algorithm development.
6
River Time Series Penobscot River Dissolved
Organic Carbon Export 2004-2007 Note, DOC
concentration and DOC export are highly variable
2004
2005
2006
2007
DOC Export (Mt/day)
DOC Concentration (mg C/L)
1/1/04
1/1/05
1/1/06
1/1/07
7/1/04
7/1/05
7/1/06
7/1/07
1/1/08
7
A River Time Series Look-up Table Developed a
response surface (look-up table) showing DOC flux
as a function of river discharge and month of
the year for the Penobscot River at Eddington in
order to model DOC flux
Huntington and Aiken
8
What is the impact of marshes and swamps on DOC
flux in a river time series?
Palustrine-Latin word "palus" or marsh.
Wetlands within this category include inland
marshes and swamps as well as bogs, fens, tundra
and floodplains. ...
Huntington et al., USGS
9
What carbon transformations can be seen in the
lower Penobscot River Time Series?
Barnard, WETLabs
10
LOBO system for following optical proxies for
carbon in Penobscot River
Barnard, WETLabs
11
Does Fcdom roughly relate to DOC in this coastal
time series?
DOC(mg/L) 0.0925 FCDOM2.25 Used to convert
CDOM fluorescence measurements to DOC
concentration. From field samples.
Barnard, WETLabs
12
Norm FCDOM-LOBO -0.000175S2 0.02525S1
Note slight curvature!
Normalize Fcdom to the maximum Fcdom
concentration in the freshwater endmember (lt 2
PSU). Reduces variance in the salinity
relationship and defines the percent loss of CDOM
at the LOBO site based on salinity relationship.
Barnard, WETLabs
13
Using optical proxies to connect terrestrial to
marine DOC in the coastal time series
- Can better describe coastal DOC trends using
measurements from further up water shed - Can discern seasonal connectivity (as well as
lack thereof).
Roessler, U.Maine
14
Moving the coastal time series into the Gulf of
MaineGNATS transect Gulf of Maine North
Atlantic Time Series11years
- Travel on clear-sky days for optimizing satellite
and ship comparisons - Use ships of opportunity to keep costs down
15
GNATS Coastal time series of detrital and
dissolved absorption (agp412) values keep going
up!
08 07 06 05 04 03 02 01 00 99 98
Wet
Wet
Wet
Wettest
Dry
16
Coastal Time Series of algal groups General
phytoplankton community estimated by Flow-Cam
17
Weve amassed historical data on same transect
back to 1979
2005 2000 1995 1990 1985 1980
Year
18
MODEL of the DOC Time Series Oct to Dec 04 05
2004-One of driest years on record
2005-Wettest year on record
Mg DOC L-1
Xue, Univ. Maine
Mg DOC L-1
19
Gulf of Maine Coastal Time Series-GNATS now
includes glider data
- The glider gives us unprecedented spatial
resolution - Gliders are slow (0.5kt), so for GoM scales (300
km) best suited to watch long time-scale change. - Chl fluorescence, bb(532), CDOM fluor, Lu(l) and
Ed(l) at 7 wavelengths - Working with Howard Gordon to do inversions to
derive a(l) and bb(l)
Depth (m)
Longitude (oW)
20
Glider time series at LEO-15 for partitioning
spatial and seasonal variance of salinity,
temperature, backscattering and chlorophyll
fluorescence
Depth (m)
Kilometers offshore
Schofield et al, Rutgers Univ.
21
(No Transcript)
22
- Using gliders in coastal time seriesLessons
learned - Gliders compliment remote sensing by a) filling
in gaps under clouds and b)providing
depth-resolved measurements - A pair of gliders during periods of rapid change
would better document smaller features than one
glider. - Validation of autonomous sensor data will require
more comprehensive measurements for validation.
Perry et al, 2008
Time-depth relationship for average data
23
Buoys provide unprecedented temporal resolution
in coastal time series 15 yr Bedford Basin
Ocean Monitoring
Cullen and Li
24
Bedford Basin, Nova Scotia
William Li Bedford Institute of Oceanography
25
GOMOOS-an amazing coastal time series
- In 8th year
- Meteorological, hydrographic, optical, CODAR data
- Hourly resolution
- Model forecasts
Pettigrew, Perrie, Roesler, Townsend and Xue
26
Monterey Bay Time Series
Temperature
Chlorophyll
Oxygen
Jumbo squid
pCO2
pH
Chavez et al.
1990 1995 2000 2005
27
pCO2
Monterey Bay Time Serieslots of variance but
statistically discernable change
pH
Chavez et al.
1995 2000 2005
28
Plumes and Blooms Coastal Time Series PREDICTING
CELLULAR DOMOIC ACID Best Full Model
Predicted
Log(cDA 1)
58 Skill obs 75
Log(cDA1)
Measured
Log(cDA1) 3.5 0.15(SST) 6.28ag(412)
0.02(Sal) 1.27Rrs (510/555) 5.06ap(510)
Anderson, Siegel, Kudela and Brzezinski, 2009
29
Predicted Particulate Domoic Acid Conc. May 2007
Aug 2007
ng/L
2.0 x 10³
0
Anderson, Siegel, Kudela and Brzezinski, 2009
30
Predicted Cellular Domoic Acid Conc. May 2007
Aug 2007
pg/cell
100
50
VALIDATION !!! 1 ) State monitoring data
being done 2) Newly funded NSF project to look
at export of domoic acid to depth (PI Claudia
Benitez-Nelson, USC) Monthly surface DA and
Pseudo-nitzschia Abund. data across SBC that
will be used to validate now-casts
0
31
GEO-CAPE a geostationary multi-discipline
observatory
- Launch 2013-2016
- Ocean Objectives
- Quantify the response of marine ecosystems to
short-term physical events, such as the passage
of storms and tidal mixing - Assess the importance of high temporal
variability in coupled biological-physicalcoastal
-ecosystem models - Monitor biotic and abiotic material in transient
surface features, such as river plumes and tidal
fronts - Detect, track and predict the location of sources
of hazardous materials, such as oil spill, waste
disposal and harmful algal blooms - Detect floods from various sources, including
river overflows
MDI spatial res100-300m Time between obs4-8h
32
Geostationary satellite observations provide
entirely new time series information to augment
other data streams
Models Regional carbon-cycle models nested
within a basin-scale ocean and atmospheric
circulation model-includes physics, biology and
biogeochemistry. dCx/dt P M horizontal
vertical
33
Geostationary observations better
differentiation of change (at smaller spatial and
temporal scales)
- Polar orbiter overpass frequency
1d-1(phytoplankton division rate) spatial
resolution 1km - In that one day, particles grow, are consumed,
sink or advected - Critical patch concept Skellam, 1951 Kierstead
and Slobodkin, 1953 Okubo, 1978 Rc 2.4048
(D/a)1/2 D horizontal eddy diffusivity a
net growth rate - Rc 2-30km in coastal zone based on typical D
and a. - Polar orbiting color sensors (D time1d, 1 km
spatial resolution ) barely can explain
variability lt Rc (where physics dominates
change). - Geostationary (D time.15-.33d, 0.25 km spatial
resolution) better resolve lt Rc.
34
Conundrum variable Cp for different organisms
Rc i 2.4048 (D/ai)1/2
- Continuum of a potentially faster for smaller
microorganisms (Sheldon et al. 1972) (Dutkiewicz,
yesterday) - Highly variable net growth rates in microbial
realm (dormant spp, opportunists, bloom formers,
viruses) (Fuhrman, Giorgio, Rivkin, Kirchman and
many others). - e.g. for constant D, Rc smaller for fast-growing
bacterial scatterers than for slow-growing, algal
absorbers. - Therefore, change in AOP, D Rrs ( D bb/ D a) at
a given pixel, between two images, will be
function of changes in D absorption (dominated by
phytoplankton) and D backscatter (dominated by
microbes) as organisms are impacted by biological
and physical factors. - Geostationary estimates of D Rrs will better
detect both physical and biological driven scales
of variability.
35
Need for understanding atmospheric optical
changes, too CoASTS (Coastal Atmosphere and Sea
Time Series)
699 bio-opt stations from 1995-2008
MERIS (01/03/02)
MODIS (18/12/99)
SeaWiFS (01/08/97)
Stations
Campaigns
G.Zibordi, J.F.Berthon, J.P.Doyle, S.Grossi, D.
van der Linde, C.Targa, L.Alberotanza. Coastal
Atmosphere and Sea Time Series (CoASTS), Part 1
A long-term measurement program. NASA Tech.
Memo. 2002-206892, v. 19, S.B.Hooker and
E.R.Firestone, Eds., NASA Goddard Space Flight
Center, Greenbelt, Maryland, 2002, 29 pp.
36
AERONET-OC
AERONET Ocean Color, resulting from a JRC-NASA
collaboration, is an integrated sub-network of
the Aerosol Robotic Network (AERONET) supporting
ocean color validation with highly consistent
time-series of LWN(?).
Attributes
- Autonomous radiometers operated on fixed
platforms in coastal regions - Identical measuring systems and protocols,
calibrated using a single reference source and
method, and processed with the same code - Standardized products of normalized water-leaving
radiance and aerosol optical thickness.
G.Zibordi et al. A Network for Standardized Ocean
Color Validation Measurements. Eos Transactions,
87 293, 297, 2006.
37
Detecting global changes in bloom magnitude
Note, most change is in coastal zone
- For each pixel, estimate trend and significance
using the Sen slope estimator Areas with
significant (90 level) increase are red,
significant decrease are in blue, grey no
significant change.
11/17/2009
Kahru and Mitchell
38
Detecting global changes in bloom magnitude
Zoom in to specific areas showing significant
changes
Some of the observed trend in bloom magnitude is
attributable to the strong El Niño of 19971998
in the start of the time series. However, bloom
magnitudes have increased in some areas even
after 1998.
- Arafura Sea, Chl-a
Kahru and Mitchell
39
Future recommendations
- Coastal time series need to better span across
entire land-sea continuum, especially if we
expect to understand the properties of
terrigenous CDOM. - Space-time resolution is much more critical in
coastal zone - Optical proxies remain key for deciphering
complex transitions in coastal zone - Take advantage of numerous assets in coastal
waters (platforms, ships, buoys, satellites) - New technologies will be key to resolve change
- Gliders
- Buoys
- Geostationary remote sensing
- If we expect to resolve physical and biological
effects in the coastal zone, we need to remotely
sense smaller spatial scales with shorter time
intervals.
40
Background c/o F. Chavez, MBARI
41
(No Transcript)
42
Aqua estimates at the mouth of Penobscot Bay
Plt0.001
X
X
X
X
43
CoASTS measurements
CoASTS measurements of AOPs and IOPs, are
produced applying identical and consolidated
technology, measurement and calibration
protocols, processing codes and quality assurance
criteria.
G.Zibordi, J.F.Berthon, J.P.Doyle, S.Grossi, D.
van der Linde, C.Targa, L.Alberotanza. Coastal
Atmosphere and Sea Time Series (CoASTS), Part 1
A long-term measurement program. NASA Tech.
Memo. 2002-206892, v. 19, S.B.Hooker and
E.R.Firestone, Eds., NASA Goddard Space Flight
Center, Greenbelt, Maryland, 2002, 29 pp.
44
AERONET- Ocean Color (2002-present)
Active sites
Current management and responsibilities
- NASA manages the network infrastructure (i.e.,
handles the instruments calibration and, data
collection, processing and distribution within
AERONET). - JRC has the scientific responsibility of the
processing algorithms, extensively contributes to
instruments calibration and performs the quality
assurance of data products. - AERONET-OC sites are established and maintained
under the responsibility of individual PIs.
45
AERONET-OC minimization of uncertainties in
regional LWN products
D.DAlimonte, G.Zibordi and F.Mélin. A
statistical method for generating cross-mission
consistent normalized water-leaving radiances.
IEEE Transactions in Geoscience and Remote
Sensing, 46, 2009.
46
- Detection of change with Ocean Color (OC)
- Several authors have tried to compare the old
(CZCS, 1978-1986) data with the new OC data but
the results are inconclusive (Gregg et al., 2003
-6 Antoine et al., 2005 22 Kahru et al.,
2007 Baltic) - Sensor calibration and inter-calibration,
especially with the old data will remain a big
problem - The period of the new OC data since Nov-1996
(OCTS) is becoming longer and the detection of
trends in OC time series is now finally becoming
possible - Following Kahru and Mitchell, 2008 (EOS)
http//spg.ucsd.edu/blooms.png and
http//spg.ucsd.edu/blooms.kmz - we search for trends in annual maxima (Chl or
NPP) based on monthly composites we call this
bloom magnitude - Bloom magnitude is typically determined by the
annual bloom (e.g. the spring bloom) or Harmful
Algal Bloom (HAB) events
11/17/2009
47
Norm FCDOM-Ed -0.000175S2
0.02525S1 FCDOM-Ed FCDOM-LOBO / Norm
FCDOM-LOBO DOCEd(mg/L) 0.0725 FCDOM-Ed2.25
S salinity at LOBO site FCDOM-LOBO CDOM
fluorescence at LOBO site Use salinity data at
LOBO to estimate the
48
Modeled DOC Export Modeled DOC export at
Eddington, ME using LOBO time series of Fcdom,
salinity, and USGS discharge data. Model uses
DOC to Fcdom relationship (Fig. 2), and salinity
to Fcdom relationship (Fig. 5) to estimate flux.
49
LOBO observations Time series (every 2 hours)
of surface temperature salinity (top), and
Fcdom (bottom). Gage height at Eddington, ME
USGS station also shown.
50
Barnard, WETLabs
51
New toolGliders can fill in an important part of
the space time continuum
- Horizontal resolution of about a kilometer
- Can deploy for time scales of weeks
- Provide depth resolved hydrographic, optical and
chemical observations over entire euphotic zone
(or beyond)
52
Generating a coastal time series of DOC Loading
DOC Load (kg d-1)
Discharge (cfs)
Barnard, WETLabs
53
How does modeled and measured DOC compare along
the GoM at GNATS?
Xue, Univ. Maine
Recommended
CrystalGraphics Presentations


