
Problem 4: Okeechobee Road Stopped Control Analysis PowerPoint PPT Presentation
Title: Problem 4: Okeechobee Road Stopped Control Analysis
1
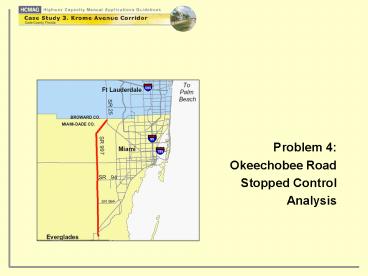
Problem 4 Okeechobee Road Stopped Control
Analysis
2
Location and Configuration
3
- T Intersection
- Very wide median
- Might operate as separate conflict points
- Right turns removed
4
Peak Hour Volumes
- Left Thru Right
- NB 257 --- 433
- EB --- 2,010 389
- WB 120 358 ---
- Whats missing and why?
- Whats critical?
- How Critical?
- What do we need to analyze?
5
Sub-problem 4a
- Examine the capacity of the critical minor
street movement (the northbound left turn) using
the graphical solution presented in the HCM,
without going through the full procedure
6
HCM Exhibit 17-7
7
What to do next?
- Normally we would stop at this point and declare
that TWSC is not a viable choice
Conclusion Volume gt Capacity
- In this case, we will proceed with more problems
to illustrate more features of the TWSC procedure
8
Sub-problem 4b
- Invoke the full HCM procedure, treating the
operation as a conventional TWSC intersection and
ignoring the unusual separation between the
conflict points.
Then examine the results to determine if our
treatment was appropriate.
9
LOS Thresholds for TWSC Intersections (HCM
Exhibit 17-2)
LOS Average Control Delay (sec/veh)
A 10
B gt 1015
C gt 15-25
D gt 25-35
E gt 35-50
F gt50
10
Assumptions
- Analysis period15 min
- No pedestrians
- No upstream signals
- PHF 0.93 for all movements
- Level Terrain
11
Input Data
EBT WBT NBL WBL NBR
Volume 2010 358 257 120 433
Number of lanes 2 2 1 1 1
Median storage N/A N/A 4 veh N/A N/A
Percent trucks 20 41 10
12
Results
EBT WBT NBL WBL NBR
Critical gap (sec) N/A N/A 7.2 4.9 7.1
Follow up time (sec) N/A N/A 3.7 2.6 3.4
Adjusted flow rate (vph) 2010 358 257 120 433
Adjusted capacity (vph) N/A N/A 69 168 226
v/c ratio N/A N/A 3.72 0.71 1.92
95 queue length (veh) N/A N/A 27.1 4.4 31.1
Delay (sec/veh) N/A N/A ??? 67 464
LOS N/A N/A F F F
While the HCM equations do not limit the range of
v/c ratios for which delay may be computed, some
software products impose limitations as a
practical consideration
13
Results
EBT WBT NBL WBL NBR
Critical gap (sec) N/A N/A 7.2 4.9 7.1
Follow up time (sec) N/A N/A 3.7 2.6 3.4
Adjusted flow rate (vph) 2010 358 257 120 433
Adjusted capacity (vph) N/A N/A 69 168 226
v/c ratio N/A N/A 3.72 0.71 1.92
95 queue length (veh) N/A N/A 27.1 4.4 31.1
Delay (sec/veh) N/A N/A ??? 67 464
LOS N/A N/A F F F
Why does the WBL have a higher capacity than the
NBL when both movements have to yield to same
conflicting volume of EB through traffic?
14
Results
EBT WBT NBL WBL NBR
Critical gap (sec) N/A N/A 7.2 4.9 7.1
Follow up time (sec) N/A N/A 3.7 2.6 3.4
Adjusted flow rate (vph) 2010 358 257 120 433
Adjusted capacity (vph) N/A N/A 69 168 226
v/c ratio N/A N/A 3.72 0.71 1.92
95 queue length (veh) N/A N/A 27.1 4.4 31.1
Delay (sec/veh) N/A N/A ??? 67 464
LOS N/A N/A F F F
Because the HCM tells us that the critical gap
and follow up times are both lower for a left
turn from the major street than from the minor
street. In other words drivers on the major
street are willing to accept smaller gaps, so
more vehicles can get through the same volume of
conflicting traffic
15
- Because of the wide separation of conflicts at
this intersection, it should occur to us that we
probably shouldnt treat this situation as a
typical urban intersection.
So, we will examine the separation of conflict
points in the next subproblem.
16
Sub-problem 4c
- Separate the conflict points for TWSC
control and treat each conflict point
individually.
Then compare the results with the treatment of
the previous sub-problem.
17
Why will the separation of conflict points
usually give a more optimistic assessment of the
operation than the aggregation of conflict points
into a single intersection?
Because there is no need to adjust the potential
capacity of any movement because of impedance
from other movements
18
When is it appropriate to separate the conflict
points?
Only when the queue from one conflict point does
not back up into an upstream conflict point
19
Input Data
Input Data EBT WBT NBL WBL NBR
Volume 2010 358 257 120 433
Number of lanes 2 2 1 1 1
Percent trucks 20 41 10
20
NB Left vs EB Through
Subproblem 4b Capacity 69
Subproblem 4c Capacity 99
95 queue length (veh) 24
Queue storage (veh) N/A
Is storage adequate? N/A
v/c ratio 2.6
Delay 814
LOS F
21
NB Left vs WB Through and Left
Subproblem 4b Capacity N/A
Subproblem 4c Capacity 559
95 queue length (veh) 2.4
Queue storage (veh) 4
Is storage adequate? Yes
v/c ratio 0.46
Delay 17
LOS C
22
WB Left vs EB Through
Subproblem 4b Capacity 168
Subproblem 4c Capacity 213
95 queue length (veh) 2.07
Queue storage (veh) 3.06
Is storage adequate? Yes
v/c ratio 0.56
Delay 41.7
LOS E
23
NB Right vs EB Through
Subproblem 4b Capacity 226
Subproblem 4c Capacity 283
95 queue length (veh) 25
Queue storage (veh) N/A
Is storage adequate? N/A
v/c ratio 1.53
Delay 287
LOS F
24
NB Right vs EB Through
Have we used the proper procedure for analyzing
the operation of the NB right turn?
25
NB Right vs EB Through
26
Sub-problem 4d
- Further Consideration of the Northbound Right
Turn
27
- The HCM does not prescribe an explicit procedure
for at-grade intersections with merge area
characteristics. - We must view the TWSC procedure as pessimistic
because of the design of the merge area.
28
- The logical next step would be to treat this
entrance as a freeway merge, using HCM Chapter
25, which prescribes a procedure for estimating
freeway merge area performance in terms of the
traffic density. - Density is used in all HCM freeway-related
chapters as an indicator of congestion level.
The density thresholds for each LOS are given in
HCM Exhibit 25-4.
29
LOS Thresholds for Merging(HCM Exhibit 25-4)
LOS Density (pc/mi/ln)
A 10
B gt 1020
C gt 2028
D gt 2835
E gt 35
F V/Cgt1.0
30
Assumptions and Parameters
- Right side entry, No other ramps present
- Driver pop. adjustment 1.0, PHF 1
- 10 Trucks and RVs
- Level terrain, 1200 foot acceleration lane
Input Data EBT NBR
Volume 2010 433
Number of lanes 2 1
Free flow speed 55 35
31
Results
EBT EBT NBR
Adjusted flow rate 2010 433 433
Merge area density 17.7 pc/mile/lane 17.7 pc/mile/lane 17.7 pc/mile/lane
LOS B B B
32
Problem 4 Conclusions
- HCM TWSC procedure applies to all movements
except the channelized right turns, which may be
eliminated from the analysis - Conflict points may be separated because queues
do not block upstream conflict points - TWSC is not a viable control mode because it will
not provide adequate capacity for all movements - Problem 5 will therefore examine signalization of
this intersection.
33
End of Presentation
Recommended
