
The Story of Wavelets Theory and Engineering Applications - PowerPoint PPT Presentation
Title:
The Story of Wavelets Theory and Engineering Applications
Description:
The Story of Wavelets Theory and Engineering Applications 2D-DWT using MATLAB (review) Implementation issues Advanced Topics: Wavelet Packets Other Applications – PowerPoint PPT presentation
Number of Views:162
Avg rating:3.0/5.0
Title: The Story of Wavelets Theory and Engineering Applications
1
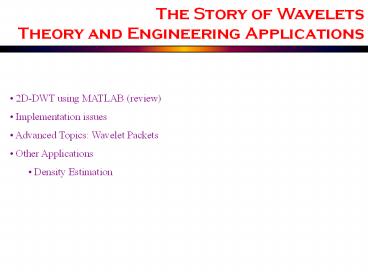
The Story of WaveletsTheory and Engineering
Applications
- 2D-DWT using MATLAB (review)
- Implementation issues
- Advanced Topics Wavelet Packets
- Other Applications
- Density Estimation
2
Recall 2D-DWT
- Just like in 1D we generated an approximation of
the 2D function f(x,y). Now, how do we compute
the detail lost in approximating this function? - Unlike 1D case there will be three functions
representing the details lost - Details lost along the horizontal direction
- Details lost along the vertical direction
- Details lost along the diagonal direction
- 1D ? Two sets of coeff. a(k,n) d (k,n)
- 2D? Four sets of coefficients a(k,n), b(k, n),
c(k, n) d(k,n)
3
Implementation of 2D-DWT
INPUT IMAGE
LLH
LH
LL
LH
LL
LHL
LHH
HH
HH
HL
HL
4
Up and Down Up and Down
Downsample columns along the rows For each row,
keep the even indexed columns, discard the odd
indexed columns
2 1
Downsample rows along the columns For each
column, keep the even indexed rows, discard the
odd indexed rows
Upsample columns along the rows For each row,
insert zeros at between every other sample
(column)
Upsample rows along the columns For each column,
insert zeros at between every other sample (row)
5
Implementing 2D-DWT
Decomposition
ROW i
6
Reconstruction
LL
H
H
LH
G
ORIGINAL IMAGE
HL
H
G
G
HH
7
2-D DWT ON MATLAB
Load Image (must be .mat file)
Choose wavelet type
Hit Analyze
Choose display options
8
Recall 1-D DWT
- In DWT, only approximation coefficients are
decomposed. - Each decomposition allows dyadic
dichotomization of the frequency spectrum - What if we were decompose the detail
coefficients as well?
Frequency
Time
9
Wavelet Packets
H
H
2
xn
B 0 ?
H
G
0 ?/2
?/2 ?
10
Wavelet Packets
Frequency
Time
11
Wavelet Packets on MATLAB
12
What About Scaling and Wavelet Functions ???
You Ask
- In DWT, we used scaling functions to generate
lowpass filters, and wavelet functions to
generate highpass filters. - In WP analysis, filters are generated by related,
but different analysis functions.
Two-scale (dilation) equations
where
2N Filter length
13
How Many Decompositions Are Too Many???
- For a signal of length N2L, we can have L levels
of 1D-DWT. - For the same signal, we can have a maximum of 2N
levels of decompositions - For a 512 sample signal ?
x10123
13407807929942597099574024998206
14
Choosing the Best Tree
- The best tree is the one that gives the most
information. - What is the most informationyou ask.
- Entropy based definitions
- Normalized Shannon entropy
- Norm based entropy
- Energy based entropy
- Threshold based entropy
- If at any level, splitting a branch results in
less sntropy, the splitting provides more
information. - Matlab Demo noisychirp
15
Density Estimation
- Density???
3 5 4 5 3 7 9 8 7 3 4 5 10 7 3 4 5 7 14 12 10 3 5
4 7 9 9 3 4 5 5 4 5 4 3 7 3 4 4 5 6 5 6 7 5 5 4
3 3 4 5 6 8 10 10 2 3 1 1 0 0 3 3 4 5 6 3 2
HISTOGRAM
Density function
16
Density Estimation
- Density estimation allows us to infer statistical
characteristics of data - From what distribution is the data coming
- Reliability, life cycle
- Average quality, etc.
mean
Number of 60W bulbs
Watts
60
17
Density Estimation
- How do we estimate density???
- Matlab demo.Load ex1cusp2.mat from wavelet
toolbox - Plot the dataWhat do you observe? Can you infer
any information from this data? - Plot as points What can you say now?
- Plot the histogram of the data gtgthist(ex1cusp2)
- Histogram can be used as a rough estimate of the
density - Too noisy
- Takes every sample into account, regardless how
irrelevant (noisy) it may be - Better way? What else, but of course,wavelets
18
Wavelets to the Rescue (again)
- If the histogram is a noisy rough estimate of the
density - Denoise histogram using wavelet shrinkage
denoising
Select wavelet
Choose denoising thresholds
Select number of bins
Select thresholding scheme
Recommended
CrystalGraphics Presentations


