
ST98-2005 - Alberta's Reserves - Graphs / Data - PowerPoint Presentation - PowerPoint PPT Presentation
1 / 84
Title:
ST98-2005 - Alberta's Reserves - Graphs / Data - PowerPoint Presentation
Description:
Title: ST98-2005 - Alberta's Reserves - Graphs / Data - PowerPoint Presentation Author: EUB Last modified by: Karen Logan Created Date: 5/23/2001 4:02:12 PM – PowerPoint PPT presentation
Number of Views:180
Avg rating:3.0/5.0
Title: ST98-2005 - Alberta's Reserves - Graphs / Data - PowerPoint Presentation
1
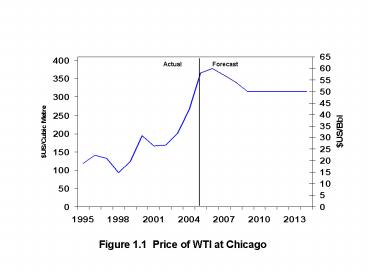
Figure 1.1 Price of WTI at Chicago
2
Figure 1.2 Average price of oil at Alberta
wellhead
3
Figure 1.3 Average price of natural gas at plant
gate
4
Figure 1.4. Alberta gas well cost
estimations Drilling, casing and completion costs
estimates (in millions 2003) By Modified PSAC
Area
Area 6
Area 7
0.27
0.42
0.45
0.29
6.2
5.5
Area 2
Area 5
1.79
1.97
Area 4
0.73
0.82
0.42
0.45
12.3
12.0
5.5
Area 1
2.29
2.29
Area 3
0.18
0.18
0.0
- Source PSAC 2004 Well Cost study (2003 dollars)
and PSAC 2002 Well Cost study (2001 dollars)
4.8
2002
2004
increase in costs (in percentage, over 2 years)
5
Figure 1.5. Alberta oil well cost
estimations Drilling, casing and completion costs
estimates. (in millions 2003) By Modified PSAC
Area
Area 7
0.78
0.85
9.0
Area 5
Area 4
0.61
0.64
0.53
0.52
4.3
-2.1
Area 3
0.66
0.75
- Source PSAC 2004 Well Cost study (2003 dollars)
and PSAC 2002 Well Cost study (2001 dollars)
13.2
2002
2004
increase in costs (in percentage, over 2 years)
6
Figure 1.6. Canadian economic indicators
7
Figure 1.7. Alberta GDP growth, unemployment
inflation rates
8
Figure 2.1. Albertas three oil sands areas
9
Figure 2.2. Comparison of Albertas crude oil and
crude bitumen reserves
10
Figure 2.3. Bitumen pay isopachs for the
Athabasca Wabiskaw-McMurray deposit at 6 mass per
cent cutoff and greater than 1.5 metres
11
Figure 2.4. Net pay isopachs for recoverable
bitumen within the Athabasca Wabiskaw-McMurray at
6 mass per cent cutoff and greater than 10
metres
12
Figure 2.5. Production of bitumen in Alberta 2004
103 m3/d
13
Figure 2.6. Alberta crude oil and equivalent
production
14
Figure 2.7. Alberta crude bitumen production
Forecast
Actual
103 m3/d
Surface Mining
In Situ
15
Figure 2.8. Total in situ bitumen production and
producing bitumen wells
16
Figure 2.9. Alberta synthetic crude oil
production
Actual
Forecast
103 m3/d
Synthetic Crude Oil
17
Figure 2.10. Alberta Demand and Disposition of
Crude Bitumen and SCO
Actual
Forecast
Nonupgraded Bitumen Removals from Alberta
103 m3/d
SCO Removals from
Alberta
Alberta Demand (mainly SCO)
18
Figure 3.1. Remaining established reserves of
crude oil
19
Figure 3.2. Annual changes in conventional crude
oil reserves
20
Figure 3.3. Annual changes to waterflood reserves
21
Fig. 3.4. Distribution of oil reserves by
size(103m3)
22
Figure 3.5. Oil pool size by discovery year
23
Figure 3.6. Initial established crude oil
reserves based on various recovery mechanisms
(106 m3)
Light-medium
Heavy
24
Figure 3.7. Geological distribution of reserves
of conventional crude oil
25
Fig. 3.8. Regional distribution of Alberta oil
reserves (106 m3)
176
159
14
21
1193
478
49
384
75
45
17
2
258
45
2004 Initial established reserves 2664.9 106 m3
2004 Remaining established reserves 249.2 106 m3
26
Figure 3.9. Albertas remaining established oil
Reserves versus cumulative production
27
Figure 3.10. Growth in initial established
reservesof crude oil
3130
Ultimate potentiial
106 m3
28
Figure 3.11. Alberta successful oil well
drilling By Modified PSAC Area
62
41
12
8
557
679
389
616
350
323
2
8
2003 Wells Drilled 2345
534
386
2004 Wells Drilled 1949
29
Figure 3.13. Initial operating day rates of oil
wells placed on production, 2004 By Modified
PSAC Area
Figure 3.12. Oil wells placed on production,
2004 By Modified PSAC Area
44
17.9 (112)
12.7 (80)
150
410
368
7.3 (46)
609
7.3 (46)
4.8 (30)
3
5.5 (34)
326
10.5 (66)
m3/day/well (bbl/day/well)
Total 1910 wells
30
(No Transcript)
31
Figure 3.15. Total crude oil production and
producing oil wells
32
Figure 3.16. Crude oil well productivity in 2004
33
Figure 3.17. Total conventional crude oil
Production by year placed on production
Percent of total production from oil wells
6
11
7
6
7
3
3
6
4
4
42
34
Figure 3.18. Comparison of crude oil production
Texas Onshore
Alberta Crude Oil
Louisiana Onshore
35
Figure 3.19. Alberta Crude Oil Price and Well
Activity
Actual
Forecast
36
Figure 3.20. Alberta daily production of crude
oil
Forecast
Actual
Production (103 m3/d)
Heavy Crude Oil
Light-Medium Crude Oil
37
Figure 3.21. Capacity and location of Alberta
refineries
Refinery Capacities - m3/d
38
Figure 3.22. Alberta demand and disposition of
crude oil
Forecast
Actual
103 m3/d
Crude Oil Removals from Alberta
Alberta Demand
39
Figure 3.23. Alberta supply of crude oil and
equivalent
Forecast
Actual
Nonupgraded Bitumen
103 m3/d
SCO
Pentanes Plus
Heavy
Light-Medium
40
(No Transcript)
41
Figure 4.1. Alberta successful gas well drilling
coalbed methane By Modified PSAC Area
613
151
3
407
2004 Wells Drilled 1174
42
(No Transcript)
43
Figure 5.1. Annual reserves additions and
production of marketable gas
44
Figure 5.2. Remaining marketable gas reserves
45
Figure 5.3. Alberta unconnected gas
reserves, 2004 By Modified PSAC Area
3
4
22
4
15
6
2
16
Total 72 109m3
Numbers not to scale
46
Figure 5.4. New, development, and revisions to
marketable gas reserves
47
Figure 5.5. Marketable Gas Reserves
Changes, 2004 By Modified PSAC Area 109m3
0.0
4.9
71.0
3.7
17.9
12.0
-3.7
40.1
Total 145.9 109m3
Numbers not to scale
48
Fig. 5.6. Distribution of Gas Reserves by
size(109m3)
49
Figure 5.7. Gas pools by size and discovery year
50
Figure 5.8. Geological distribution of marketable
gas reserves
51
Figure 5.9. Remaining marketable reserves of
sweet andsour gas
109 m3
Sweet Natural Gas
Sour Natural Gas
52
Figure 5.10. Expected recovery of natural gas
components
53
Figure 5.11. Growth of initial established
reserves of marketable gas
Ultimate potential (6.52)
Actual as of December 31, 2004
1012 m3 at 37.4 MJ/m3
54
Figure 5.12. Gas ultimate potential
Ultimate potential based on 2004 study
109 m3
Remaining reserves
Production
55
Figure 5.13. Regional Distribution of Alberta
Gas Reserves (109 m3)
197
90
36
204
61
52
1706
220
95
48
904
643
403
272
155
214
52
109
183
256
953
43
Initial established reserves 4547 109m3
338
169
Remaining established reserves 1127 109 m3
Yet-to-be established reserves 1729 109m3
56
Figure. 5.14. Regional Distribution of
Albertas Ultimate Potential for Conventional
Natural Gas (109 m3)
401
341
151
103
315
180
2374
2349
1176
1044
323
225
434
439
1122
889
Ultimate Potential 2004 1 6276 109 m3
Ultimate Potential 1991 2 5600 109m3
1 as-is heating value 2 37.4 MJ/m3
57
Figure 5.15. Gas in place by geological period
58
Figure 5.16. Alberta successful gas well drilling
- conventional By Modified PSAC Area
477
469
243
163
346
357
1792
2562
1482
2049
898
811
6567
6609
85
102
2003 Wells Drilled 12060
2004 Wells Drilled 12960
59
Figure 5.17. Successful conventional gas wells
drilled and connected
Number of Wells
60
Figure 5.19. Initial operating day rates of
connections, 2004 By Modified PSAC Area
Figure 5.18. Conventional gas well connections,
2004 By Modified PSAC Area
418
7 (0.25)
263
5 (0.18)
19 (0.67)
253
2111
1743
1080
8 (0.28)
20 (0.71)
5 (0.18)
7107
84
65 (2.30)
4 (0.14)
103m3/day/well (MMcf/day/well)
Total 13 059 wells
61
(No Transcript)
62
(No Transcript)
63
(No Transcript)
64
Figure 5.23. Raw gas production by connection year
Percentage of Total Production from Gas Wells in
2004
13
16
11
9
7
5
5
4
3
2
26
Connection Year
65
Figure 5.24. Average initial natural gas well
productivity in Alberta
66
Figure 5.25. Alberta Natural Gas Well Activity
and Price
Actual
Forecast
67
Figure 5.26. Disposition of conventional
marketable gas production
7.1
Actual Forecast
5.3
109 m3
Tcf
3.6
1.8
25
23
27
36
42
Removals from Alberta
Alberta Demand
68
Figure 5.27. Comparison of natural gas production
Texas Onshore
Tcf
Louisiana Onshore
Alberta
69
Actual Forecast
70
Actual Forecast
71
Figure 5.30. Alberta natural gas storage
injection/withdrawal volumes
106 m3
72
Figure 5.31. Alberta marketable gas demand by
sector
Actual Forecast
Re-processing Plant Shrinkage
Transportation
Electricity Generation
109 m3
Other Industrial
Industrial - Petrochemical
Industrial Oil Sands
Commercial
Residential
73
Figure 6.1. Remaining established NGL reserves
expected to be extracted and annual production
74
Figure 6.2. Remaining established reserves of
natural gas liquids
75
Alberta Gas NGL Market
R
Battery
Other Canadian Markets
Battery
R
Field Plants
Gas Pools
- Straddle Plants
- NGL Mix
- Ethane
- Propane
- Butanes
- Pentanes Plus
US Markets
Raw Gas
Marketable Gas
R
Sulphur
Alliance High Pressure Pipeline
- - NGL Mix
- Ethane
- Propane
- Butanes
- Pentanes Plus
- Fractionation Plants
- Ethane
- Propane
- Butanes
- Pentanes Plus
Dry Gas
Dry or rich gas
NGL Mix
Spec product
Alberta Border
Rich gas
Refineries
R
Point royalties collected
Oil Pools
Figure 6.3. Schematic of Alberta NGL flows
76
Figure 6.4. Ethane supply and demand
103m3/d
Actual Forecast
77
Figure 6.5. Propane supply from natural gas and
demand
103m3/d
Actual Forecast
excludes solvent flood volumes
78
Figure 6.6. Butane supply from natural gas and
demand
103m3/d
Actual Forecast
excludes solvent flood volumes
79
Figure 6.7 Pentane supply from natural gas and
demand
103m3/d
Actual Forecast
excludes solvent flood volumes
80
Figure 7.1. Sources of sulphur production
Actual Forecast
Refining and Upgrading
Sour Gas
81
Figure 7.2. Sulphur production from oil sands
82
Figure 7.3. Canadian sulphur offshore exports
83
Figure 7.4. Sulphur demand and supply in
Alberta
Actual Forecast
Stockpile
Removed from Province
Alberta Demand
84
Figure 8.1. Alberta Marketable Coal Production
Million tonnes
Recommended
CrystalGraphics Presentations


