
3.1 Lattice Disorder and Association of Defects PowerPoint PPT Presentation
1 / 16
Title: 3.1 Lattice Disorder and Association of Defects
1
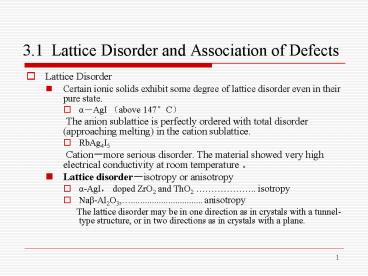
3.1 Lattice Disorder and Association of Defects
- Lattice Disorder
- Certain ionic solids exhibit some degree of
lattice disorder even in their pure state. - a-AgI (above 147C)
- The anion sublattice is perfectly ordered
with total disorder (approaching melting) in the
cation sublattice. - RbAg4I5
- Cation-more serious disorder. The
material showed very high electrical conductivity
at room temperature ? - Lattice disorder-isotropy or anisotropy
- a-AgI, doped ZrO2 and ThO2 .. isotropy
- Naß-Al2O3,...............................
anisotropy - The lattice disorder may be in one
direction as in crystals with a tunnel-type
structure, or in two directions as in crystals
with a plane.
2
3.1 Lattice Disorder and Association of Defects
- Association of Defects
- Defects which caused by different valency-doped
- randomly
distributed over the appropriate sublattice sites
- often carry a
net charge - e.g. ZrO2CaO, CaZr (Ca2 ion occupying a
Zr4 ion site carries a net effective charge of
-2 ) - VO(The oxygen ion
vacancy has a net effective charge of 2) - ZrO2YO1.5, YZr (A net effective
charge of -1) - VO(The oxygen ion
vacancy has a net effective charge of 2) - The formation of defect pairs or larger clusters
- Dynamic forceelectrostatic attraction
between charged defects. - Electric propertylarger clusters may be
electrically neutral or carry a net charge. - The concentration of free and quasifree defects
- Due to such association of defects, the
concentration of free or quasifree defects does
not increase linearly with increasing defect
concentration and may decrease with decreasing
temperature.
3
3.1 Lattice Disorder and Association of Defects
- The evaluation about the degree of association
defects - Lidiard has shown that, if the concentration of
RX2-type impurity in MX-type compound is x, the
degree of association ß which is defined in such
a way that xß represents the mole fraction of
complexes, is given by - ß/(1-ß)2Oexp(G/kT)
- O-the number of distinct orientations of
the complex - G-the Gibbs free energy of association,
i.e., the work gained under conditions of
constant pressure and constant temperature in
bringing a vacancy from a particular distant
position to a particular nearest-neighbor
position of the impurity ion - T-absolute temperature
- k-Boltzmanns constant
- The ionic conductivities of the impure crystals
- s/s0(AB/A)/(1B)
- s,s0-the ionic conductivities of the impure and
pure crystals - Ax1/x0x0/x2, x1,x2-mole fractions of the two
intrinsic defects in the dissociated
state.x1x2x02 - B-ratio of the mobilities of defects 2 and 1
4
3.1 Lattice Disorder and Association of Defects
- At a given temperature, the conductivity varies
with the impurity addition at first linearly(up
to about 1 defect concentration) and then at a
decreasing rate until it becomes nearly
asymptotic. - The impact of anion vacancy concentration on
ionic conductivity in fluorite solid solution.
The above analysis appears to break down when
the defect concentration is beyond about 3-4,
since the conductivity then decreases with
increasing defect concentration. At these high
defect contents, clustering or ordering of
defects starts.
5
3.1 Lattice Disorder and Association of Defects
- A great deal of research work about the theory of
association defects have been done - Bakerthe number of anions taking part in cluster
formation as a function of anion vacancy
concentration in fluorite-type phases. - OKeefehave studied about the nearest-neighbor
interaction in a simple cubic lattice. - Dipoles
- Positive and negative charges separated by a
distance. - Dipoles generated by charged defectsrespond to
an alternating electrical field or mechanical
stress and give rise to dielectric and mechanical
loss, which is a function of frequency,
temperature, and concentration. - The behavior of larger complexes is expected to
be different from that of dipoles.
Recent calculations based on near-neighbor
interactions show that the effective charge
carrier concentration goes through a maximum at a
certain dopant level in massively defective
solids. When very large defect contents are
involved,new compounds can occur.
6
3.2 Defect Equilibria
- The concentration of a thermally generated point
defect - It is a function of the energy of defect
formation. Using standard statistical
thermodynamic treatment, it can be shown that, in
an ionic crystal MX- - For Schottky defects
- ns/Nexp(-?Gs /2kT)
- For Frenckel defects
- nF/(NNi)1/2exp(-?GF /2kT)
- nS, nF-the numbers of Schottky and Frenckel pairs
- N-the total number of ions in the crystal
- Ni-the number of interstitial positions in the
crystal - ?GS-the energy required to form a Schottky pair
- ?GF - the energy required to form a Frenckel pair
7
3.2 Defect Equilibria
- Thermodynamically, each type of point defect is
considered as an individual chemical species, and
thus a defect equilibrium is represented by a
form of chemical equation. - Application of the law of mass action and the
concept of equilibrium constant together with the
electrical neutrality condition enable one to
calculate the equilibrium concentration of each
of the defects as functions of the partial
pressures of the components. - For simplicity, infinitely dilute solutions of
defects are considered so that activities can be
equated to concentrations.
8
3.2 Defect Equilibria
- For example pure ThO2 and Y2O3 doped ThO2
- At high oxygen pressures
- Pure ThO2 exhibits positive hole
(electronic) conduction due to equilibrium
between oxygen in the surrounding atmosphere and
interstitial oxygen ions, Oi, in the lattice, - ½ O2 Oi 2h
- K1 Oi p2 pO2-1/2
p-the number of positive holes per unit
volume - The requirement of electrical neutrality
in pure ThO2 - Oi ½ p, ? p? pO21/6
- At low oxygen pressures and high temperatures
- Oxygen vacancies are formed, which are
electrically compensated by electrons dissociated
from vacant oxygen sites, - OO ½ O2 (g) VO 2e
- K2VO n2 pO21/2
n-the number of excess electrons per unit volume - if VO ½ n, n? pO2-1/6
9
3.2 Defect Equilibria
- At any oxygen pressure
- An equilibrium between interstitial
oxygen ions and oxygen vacancies OO
VO Oi - K3 OiVO
10
3.2 Defect Equilibria
- When aliovalent impurities are added as in
ThO2-Y2O3, the electrical neutrality requires
that - p 2VOn 2Oi YTh
- If the added Y2O3 dopant is more than a trace,
YTh predominates on the right side of the
above equation. - Electrical neutrality is established by
electronic defects pYTh - Electrical neutrality is established by
electronic defects 2VOYTh - Of these two possible modes of compensation, the
latter is confirmed by experiment.
11
3.2 Defect Equilibria
- Analysis similar to that used for pure ThO2 is
applied to the case of Y2O3-doped ThO2 - At high oxygen pressures
- K1Oip2pO2-1/2
- OiVOK3
- For doping ThO2,VOconstant, ? Oiconstant
- ? p? pO21/4
- At extremely high oxygen pressures
- Y2O3 2YTh VO 3OO (2ZrO2)
- ½ O2 VO OO 2h
- Electrical neutrality condition
YThh
12
3.2 Defect Equilibria
- At low oxygen pressures
- K2 VOn2pO21/2
- n?PO2-1/4
- These two terms cancel each other at intermediate
oxygen pressures when the materials becomes
predominantly an ionic conductor. - The foregoing results can conveniently be
summarized in a Kröger-Vink-type diagram.
13
3.2 Defect Equilibria
14
3.2 Defect Equilibria
- Point defects and temperature
- Point defects are in thermal equilibrium with the
crystal, their concentrations are greatly
influenced by temperature. - The concentrations of intrinsic Schottky and
Frenckel pairs - Similar expressions may be obtained for a highly
doped material like Y2O3-ThO2. - (Ionic conduction region which is given
above) - The concentration of oxygen vacancies
- VO1/2 YThYT constant, so it is
independent of temperature. - However, according toK3 OiVO
- ? OiK3/ VOK30exp (-?G3/kT)/ ½ YTh
const exp (-?G3/kT) - ?G3 is the free energy change for the reaction(OO
VO Oi).
15
3.2 Defect Equilibria
- The concentration of Oi increases with
temperature until it becomes equal to VO. - At that temperature the equilibrium condition
changes and the material shows an intrinsic
behavior. - The concentrations in this range are given by
- Oi VO(K30)1/2 exp (-?G3/2kT)
16
3.3 Energy of Formation and Motion of Defects
- Energy of defects formation
- Born modelhas been used for the calculation of
energies and motion of simple defects in alkali
halides and the alkaline earth halides. - Franklin has calculated the energies of formation
for defects in CaF2. - anion Frenckel 2.70.4 eV/pair
cation Frenckel 7.11.0 eV/pair - Schottky defects 5.80.8 eV/pair
- Obviously anion Frenkel pairs must be the
dominant defects. - This is consistent with Ures experimental value
of 2.8eV for the formation of anion Frenkel pairs
found from conductivity measurements - Energy of motion of defects
- Born modelcan be used for calculating the energy
of the migration of defect. - The method consists mainly
of calculating the energy of the defect at a
saddle point position in an assumed path of the
defect. - The path which gives the smallest value of the
saddle point energy is the most probable path for
the migration of the defect. - Chakravorty has found the values of activation
energies for migration of anion vacancy and
interstitial in CaF2. - The values are 2.08 and 1.56eV for migration by
interstitial and interstitialcy merchanism,
respectively. - The experimentally value1.55 eV
Recommended
