
Intergovernmental Panel on Climate Change IPCC global change predictions - PowerPoint PPT Presentation
1 / 32
Title:
Intergovernmental Panel on Climate Change IPCC global change predictions
Description:
Figure 17: Anthropogenic emissions of CO2, CH4, N2O and sulphur dioxide for the ... Figure 9.11: The multi-model ensemble annual mean change of the precipitation ... – PowerPoint PPT presentation
Number of Views:34
Avg rating:3.0/5.0
Title: Intergovernmental Panel on Climate Change IPCC global change predictions
1
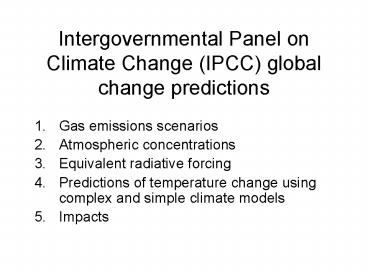
Intergovernmental Panel on Climate Change (IPCC)
global change predictions
- Gas emissions scenarios
- Atmospheric concentrations
- Equivalent radiative forcing
- Predictions of temperature change using complex
and simple climate models - Impacts
2
- Common standardized scenario for GH gas emission
scenarios (used for idealized studies and AOGCM
model inter-comparisons - CO2 increases at 1 per year compounded until it
reaches 2 or 4 times initial, and is then held
constant - (CO2 wont increase this fast, but it wont
abruptly stop increasing either)
Global temperature change for 1 yr-1 CO2
increase with stabilisation at 2xCO2 and 4xCO2.
Red curves are from a AOGCM simulation
(GFDL_R15_a) green curves are from a simple
model with no heat exchange with the deep ocean.
The transient climate response is the change at
the time of CO2 doubling equilibrium climate
sensitivity, T2x, is the change after the system
reaches a new equilibrium (after the additional
warming commitment has been realised)
3
The storylines of the Special Report on
Emissions Scenarios (SRES)
- A1. A future world of rapid economic growth,
global population peaks mid-century and then
declines, rapid introduction of new and more
efficient technologies. - convergence among regions, capacity building and
increased cultural and social interactions,
substantial reduction in regional differences in
per capita income. Three A1 groups are
distinguished by technological emphasis - A1FI fossil intensive, A1T ½ non-fossil
energy sources, A1B a balance of sources - A2. A heterogeneous world. Self-reliance and
preservation of local identities. Fertility
patterns across regions converge slowly,
continuously increasing population. Economic
development is regional and per capita economic
growth and technology change are fragmented and
slow - B1. A convergent world with the same global
population that peaks in mid-century and declines
(as in A1), but with rapid change in economic
structures toward service/information economy,
reductions in material intensity, introduction of
clean and resource-efficient technologies. - Global solutions to economic, social and
environmental sustainability, including improved
equity, but without additional climate
initiatives
- B2. A world which emphasizes local solutions
to economic, social and environmental
sustainability. - Continuously increasing global population at a
rate lower than A2 - intermediate levels of economic development
- less rapid and more diverse technological change
than in the B1 and A1. - This scenario is also oriented towards
environmental protection and social equity, it
focuses on local and regional levels.
http//www.grida.no/climate/ipcc_tar/wg1/343.htm
http//www.grida.no/climate/ipcc/emission/
4
Figure 17 Anthropogenic emissions of CO2, CH4,
N2O and sulphur dioxide for the six illustrative
SRES scenarios, A1B, A2, B1 and B2, A1FI and A1T.
For comparison the IS92a scenario is also shown.
Based on IPCC Special Report on Emissions
Scenarios.
5
Gas emissions scenarios atmospheric
concentrationsradiative forcing potential
- Radiative forcing
- The radiative forcing of the surface-troposphere
system due to the perturbation/introduction of an
agent (say, a change in greenhouse gas
concentrations) is the change in net (down
minus up) irradiance (solar plus long-wave in
Wm-2) at the tropopause but with surface
and tropospheric temperatures and state held
fixed at the unperturbed values
http//www.grida.no/climate/ipcc_tar/wg1/214.htm
6
(No Transcript)
7
These stay the same
8
(No Transcript)
9
(No Transcript)
10
Feedbacks and interactions between components of
the Earth climate system
- If radiation were the whole story we could
calibrate a simple climate change model with
existing observations and make a prediction - Temperature change alters the atmosphere, ocean
and land surface - Fast feedbacks
- Heatingwater vapor GH gas more heating (ve)
- Heatingwater vapor clouds albedo cooling
(-ve) - Heating ice melt albedo warming (ve)
11
AOGCMs spatially resolve temperatures, winds,
moisture, and step forward in time solving the
equations of motion for mass, momentum and heat.
12
Feedbacks and interactions between components of
the Earth climate system
- Fast feedbacks
- Can be modeled with AOGCMs
- Uncertainty in some interactions
- Difficult to include slow feedbacks
- Slow feedbacks (100s to 1000s of years)
- Biogeochemistry of marine carbon cycle (source of
uncertainty) - Sedimentation
- Ice sheets
- use Simple Climate Models calibrated with AOGCMs
- Climate sensitivity analysis of AOGCMs (DT for 2
x CO2) only considers fast feedbacks - Cant afford to run coupled AOGCMs for 1000s of
years - use Simple Climate Models calibrated with AOGCMs
13
Figure 9.3 The time evolution of the globally
averaged (a) temperature change relative to the
control run of the CMIP2 simulations (Unit C).
14
- Global mean temperature projections for 6 SRES
scenarios using a simple climate model tuned to
complex models. (Also shown results for IS92a.) - Dark shading is envelope of the full set of 35
SRES scenarios using the average model
(sensitivity of 2.8C) - Light shading envelope of all 7 models (climate
sensitivity in range 1.7 - 4.2C)
15
A2
Figure 20 The annual mean change of the
temperature (colour shading) and its range
(isolines) (Unit C) for the SRES scenario A2
(upper panel) and the SRES scenario B2 (lower
panel). Both SRES scenarios show the period 2071
to 2100 relative to the period 1961 to 1990 and
were performed by OAGCMs.
B2
16
The annual mean change of the temperature (colour
shading) and its range (isolines) (Unit C) for
the SRES scenario A2 (upper panel) and the SRES
scenario B2 (lower panel). Both SRES scenarios
show the period 2071 to 2100 relative to the
period 1961 to 1990 and were performed by OAGCMs.
17
Figure 9.11 The multi-model ensemble annual mean
change of the precipitation (colour shading), its
range (thin red isolines) (Unit ) and the
multi-model mean change divided by the
multi-model standard deviation (solid green
isolines, absolute values) for the SRES scenario
A2.
18
Figure 9.21 Simulated water-volume transport
change of the Atlantic conveyor belt (Atlantic
overturning) in a range of global warming
scenarios computed by different climate research
centres. Shown is the annual mean relative to the
mean of the years (1961 to 1990) (Unit SV, 106
m3s-1). The past forcings are only due to
greenhouse gases and aerosols. The future-forcing
scenario is the IS92a scenario.
19
- Figure 9.26 Standard deviations of Niño-3 SST
anomalies (Unit C) through time for transient
greenhouse warming simulations (black line) from
1860 to 2100 and for the same period of the
control run (green line). - ECHAM4/OPYC model. Red line Observed from 1860
to 1990. Simulated and observed SST anomalies
exhibit trends towards stronger interannual
variability, with pronounced inter-decadal
variability superimposed - (b) HadCM3 model
20
(No Transcript)
21
(No Transcript)
22
Simple Climate Models
- 8.3.2 Three-dimensional Climate Models
- Complex Atmosphere-Ocean General Circulation
Models (AOGCM) involve coupling comprehensive
three-dimensional atmospheric (AGCMs) and ocean
general circulation models (OGCMs) with sea-ice
models and models of land-surface processes. - AOGCMs information about the state of the
atmosphere and the surface ocean is used to
compute exchanges of heat, moisture and momentum
between the two components. - Computational limitations mean that many sub-grid
scale processes are parametrized - Occasionally AGCMs with simple mixed-layer ocean
models (much utilised in the SAR) are still used. - 8.3.3 Simple Climate Models (SCM)
- Simplifications can be made so that the climate
model has reduced complexity (e.g., a reduction
in dimensionality to two or even zero). Simple
models allow study of potential sensitivity to a
particular process over a wide range of
parameters - Simple upwelling diffusion-energy climate models
have been used to evaluate Kyoto Protocol
implications - SCMs rely on climate sensitivity and ocean heat
uptake parameters based on coupled AOGCMs
modified with ice-melt parameters based upon more
complex ice sheet and glacier models - The full coupling and feedback between components
is lost, but still allows for a first-order
analysis of various post-Kyoto emission
reductions - SCMs are also used within larger integrated
assessment models to analyse the costs of
emission reduction and impacts of climate change
23
Building a Simple Climate Model
24
(No Transcript)
25
Building a Simple Climate Model
Illustration of an upwelling-diffusion climate
model, consisting of a single atmospheric box, a
surface layer representing both land and the
ocean mixed layer, and a deep ocean. Solar and
infrared radiative transfers, air-sea heat
exchange, and deep ocean mixing by diffusion and
thermohaline overturning are all represented.
26
Building a Simple Climate Model
Illustration of a variant of the 1-dimensional
upwelling-diffusion model having separate land
and sea boxes within each hemisphere, and
separate polar sinking and upwelling in each
hemisphere.
27
Steps involved in calculating greenhouse gas and
aerosol concentration changes, climatic change,
and sea level rise. Simple Climate Models are
used within many of these connections.
28
(No Transcript)
29
(No Transcript)
30
(No Transcript)
31
(No Transcript)
32
Regional models are used for impact assessments
and response planning. They consider
- Agriculture/silviculture
- Energy use
- Public risk
- Public health
- Climate variability
- Migration
- Mix/max temps, frost, precip
- Temperature (consumption), storage (hydro)
- Storm tracks, sea level, floods
- Disease, food, stress
- ENSO, NAO
- Climate stress driving social displacement
33
(No Transcript)
34
(No Transcript)
Recommended
CrystalGraphics Presentations


