
1'9 Solving Through Graphs - PowerPoint PPT Presentation
1 / 32
Title:
1'9 Solving Through Graphs
Description:
that point is the x-coordinate of when y = 0 so it tells me for what value of x ... Recall that a function has a unique value for every x coordinate ... – PowerPoint PPT presentation
Number of Views:21
Avg rating:3.0/5.0
Title: 1'9 Solving Through Graphs
1
1.9 Solving Through Graphs
- We have applied algebraic techniques to solve
equations and inequalities - We can also derive solutions by graphing the
equation or inequality and examining the
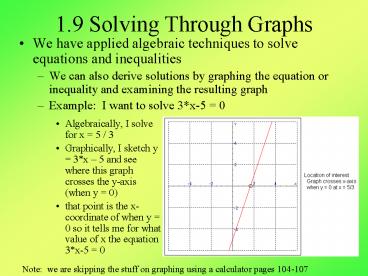
resulting graph - Example I want to solve 3x-5 0
- Algebraically, I solve for x 5 / 3
- Graphically, I sketch y 3x 5 and see where
this graph crosses the y-axis (when y 0) - that point is the x-coordinate of when y 0 so
it tells me for what value of x the equation
3x-5 0
Note we are skipping the stuff on graphing
using a calculator pages 104-107
2
Strategy for Solving Graphically
- Move all terms to one side so that the equation
is equal to 0 - Change 0 to y
- Graph the resulting equation
- Look for the value where the graph crosses the
y-axis - The point where the graph crosses the y-axis
gives you the value of x where y 0, or the
solution to the equation - Note that this technique may or may not be easier
than the algebraic solution - it depends on how difficult it will be to derive
the solution algebraically and how complicated
the graph is to draw - also note that unless you are very precise in
drawing your graph, your answer will probably
only be an approximate solution
3
Quadratic Example
Solve x2 4x 2 0 Algebraically, we would
use the Quadratic formula giving us
Graphically, we plot values for x until we derive
the parabolic shape, as shown to the right The
solution is where y 0, which occurs roughly at
x .6 and 3.4
4
Two More Examples
- x2 4x 4 0
- algebraically we factor the equation to get (x
2)2 0 or x 2 - or, we have the graph shown to the right which,
as you can see, intersects the y-axis at x 2 - x2 4x 6 0
- algebraically, use the Quadratic equation and get
x - since we cant take the square root of -8, this
equation has no real solutions, and we confirm
this in our graph by seeing that it never crosses
the y-axis!
5
Solving Two Equivalent Expressions
- Previously, we moved all of the terms to one side
of our equation, we can also solve an equation by
plotting both sides of the equality and seeing
where they intersect
We want to solve 5 3x 8x
20 Algebraically, we get 11x -25, or x is
about -2.3 We graph y1 5 3x and y2 8x
20 (as shown to the right) They intercept at
(2.3, -1.8) The y-value is immaterial, so the
solution is x -2.3 (approx)
6
Solving Inequalities
- Recall to solve an inequality algebraically, we
first had to find the proper intervals and then
determine which intervals represented the
solution - Here, we graph the inequality by graphing the
equation itself and then denoting which side of
the graph represents the inequality - We then select the proper intervals
- An example will better illustrate this
7
Example
We want to solve x2 5x 6 lt 0 We start by
graphing y x2 5x 6 The graph is shown to
the right There are 3 intervals
Interval occurs at y gt 0 Interval occurs at y
lt 0 Interval occurs at y gt 0
Since we are interested in where the values of x
give us lt 0, we want the interval where y lt
0 so we get 2, 3 as our interval or solution
8
More Inequality Examples
- 3.7x2 1.3x 1.9 lt 2.0 1.4x
- we graph y1 3.7x2 1.3x 1.9
- we graph y2 2.0 1.4x
- the solution is y1 lt y2, or this region
- which is about -1.45, 0.72
- x3 5x2 gt -8
- we write this as
- x3 5x2 8 gt 0
- the graph is shown on the right, the solution is
where the graph is on or above the y-axis
9
1.10 Lines
- Here, we examine equations for straight lines
- A line has a steepness how quickly it rises or
falls, we will call this the slope of the line - slope rise / run
- rise the change in the y-coordinate
- run the change in the x-coordinate
- slope (y2-y1) / (x2-x1)
- if we think of the x-coordinate as time, then the
slope is the change over some unit of time - see figures 1-2 on page 114 for some examples of
slope and figure 4 on page 115 for lines with
several different slopes - two special lines
- a vertical line has x2 x1, so there is no
change in run, such a line has no slope since we
cannot divide by 0 - a horizontal line has y2y1, so the slope is
always 0
10
Point-Slope Formula
- Given 2 points, (x1, y1) and (x2, y2) the slope
is (y2-y1) / (x2 x1) or (y1-y2) / (x1-x2) - We will often label the slope using variable m
- m (y2-y1) / (x2-x1)
- Given the slope of a line, and any point on the
line, we can define the line - Assume the point is (x1, y1), then the line is
defined as - y y1 m(x x1) ? y mx x1 y1
- Since (x1, y1) is a known point, these will be
two real values that we can plug into the
equation - For instance, a line of slope m 2 that runs
through (3, 1) is defined by the equation - (y 1) 2 (x 3) ? y 2x 6 1 ? y 2x
5 or 2x y 5 0 - Our line equation is then defined as y mx b
- m is the slope as defined before
- b is the y-intercept
- this is the y-coordinate where the line crosses
the y-axis
11
Example
- Lets find the equation of the line that contains
the two points (3, 1) and (6, 4) - m (4 1) / (6 3) 3 / 2 1.5
- Now, we use one of the points to use in our
point-slope form - Ill just pick the first point (3, 1)
- y 1 (3/2) (x 3) ? y (3/2) x 7/2
- We can verify the correctness of the line by
using the second point (plug in 6 for x and see
if you get 4 for y) - y 1.5 6 3.5 7.5 3.5 4, so the
equation is correct - This line crosses the y-axis at y -3.5
- we verify this by plugging in x 0 (the location
where the line will cross the y-axis) and we get
-3.5 - we can also rewrite this equation by multiplying
by 2 to get 2y 3x 7 and then move the terms
all on the same side to get 3x 2y 7 0
12
More Examples
- Find an equation of the line through (1, -3) with
slope ½ - y y1 m(x x1) ? y - -3 -1/2(x 1) ? y4
-1/2x ½ ? x 2y 5 0 - Find an equation of the line that passes through
both (-1, 2) and (3, -4) - slope (-4 2) / (3 - -1) -6/4 -3/2
- y 2 -3/2(x - -1) ? y 2 -3/2x -3/2 ? 3/2x
y ½ 0 ? 3x 2y 1 0 - Find the equation of the line with slope 3 and
y-intercept -2 - the y-intercept occurs when x 0, so we have a
point (0, -2) and slope of 3 giving the equation
for a line as - y - -2 3(x 0) ?y 3x 2
- Find the slope and y-intercept of the line 3y
2x 1 - rewrite the line as 3y 2x 1 ? y 2/3 x 1/3
- so slope is m 2/3
- y-intercept occurs at x 0 which is b 1/3
13
Even More Examples
- Graph the equations x 3 and y -2
- See the graph to the right
- x 3 is in red, y -2 is in green
- Graph the equation 2x 3y 12 0
- first we place it in the form of a line ? 3y 2x
12 ? y 2/3 x 4 - so the slope is 2/3, the x-intercept occurs at y
6 and the y-intercept occurs at x -4
14
More Concepts
- Every linear equation ax by c 0 is a line
as long as a and b are not both 0 - Two non-vertical lines are parallel if and only
if they have the same slope - Two lines are perpendicular if and only if their
slopes when multiplied together -1 - That is, if line1 has slope m1 and line2 has
slope m2 then the two lines are perpendicular if
m1m2 -1 - There is one notable exception, horizontal and
vertical lines are perpendicular although we
cannot use the above definition because the
vertical line has no slope
15
Examples
- Find an equation of the line through point (5, 2)
that is parallel to the line 4x 6y 5 0 - first we find the slope of the line 4x 6y 5
0 ? 6y -4x 5 ? y -2/3x 5/6 - so the slope of both lines is -2/3
- the parallel line then is (y 2) -2/3(x 5) ?
y 2 -2/3x 10/3 ? 2x 3y 16 0 - Show that the points (3, 3), (8, 17), and (11, 5)
are the vertices of a right triangle - recall that in a right triangle, two lines are
perpendicular, so all we have to do is show that
two of the three lines are perpendicular to each
other - Slope of line (3, 3) (11, 5) (5 3)/(11 3)
2/8 1/4 - Slope of line (8, 17) (11, 5) (5 17)/(11
8) -12/3 -4 - since ¼ -4 -1, the lines are perpendicular
- Find the line perpendicular to 4x 6y 5 0
and passes through the origin - our line is y (-4x 5)/6 -2/3x 5/6, so the
slope is -2/3 - a perpendicular line will have the slope 3/2 and
since it passes through the origin, we know one
of its points is (0, 0) so the line is - y 0 3/2(x 0) ? y 3/2x
16
Applications
- We will use equations of lines to compute
rate-of-change problems - Example dam is built on a river to create a
reservoir. Water level in feet, w, is given by
the equation w 4.5t 18 (t is time in years
since dam was constructed) - We might ask at what time the water level will
exceed 50 feet (50 4.5t 18, solve for t) - We might ask how fast the water level rises each
year (4.5 feet) - We might want to know what the water level was at
year 0 (18)
17
Two More Examples
- As dry air moves upward, it expands and cools
- If the ground temp 20 C and at a height of 1 km
is 10 C, express the temperature T in terms of
height h (assume relationship is linear) - Our two points are (0, 20) and (1, 10) so m
(20-10)/(0-1) -10 - b (the y-intercept) occurs when x 0, so is 20
- The relationship is then
- T -10 h 20
- At what is the temperature at 2.5 km?
- T -102.5 20 -5 C
- Economists have provided supply-demand equations
for a commodity - supply y 8p-10
- demand y -3p 15
- y is amount produced, p is price
- The equilibrium point is the point where the two
graphs intersect - 8p 10 -3p 15 ? 11p 25, or p 2.27
18
2.1 What is a Function?
- A function, f, is a rule that assigns to each
element x in a set A exactly one element, called
f(x) in set B - Alternatively, think of function f as a machine
that takes an input x and maps it to a value f(x) - The possible values for x (that is, the set A) is
called the domain - The possible values that f(x) can generate is
known as the range - We refer to the value x as the independent
variable because we can arbitrarily pick any
value to use as x as long as it is in A - We refer to the value f(x) as the dependent
variable because the value is dependent on x
We can also think of a function as a series of
mappings of values in set A to set B as seen
to the right
19
Why Functions?
- We use functions to describe mathematically
real-world relationships - your height as a function of age
- the temperature as a function of the date
- cost of mailing a package as a function of its
weight - notice in the last case, we can define a precise
function, but in fact your height is not exactly
linked to a specific age as people grow
differently - see page 143 for examples of these three
functions - We also find
- the area of a circle is a function of its radius
(given the radius, we can compute the area) - the weight of an astronaut is a function of her
height above the Earth
20
Example Functions
- The square function is continuous
- Other functions are discrete or piece-wise
- f(x) 1 x if x lt 1 x2 if x gt
1 - If we graph a piece-wise function, we do not get
a continuous sketch, at x 1, the sketch is
interrupted - f(-2) 3
- f(1) 0
- f(2) 4
- f(3) 9
- Square f(x) x2
- f(3) 9
- f(-2) 4
- f(5½ ) 5
- for this function, the domain is all real
numbers, the range is y y gt 0, that is, all
0 or positive real numbers - f(x) 3x2 x 5
- f(-2) 3(-2)(-2)(-2)5 5
- f(0) 300 0 5 -5
- f(4) 344 4 5 47
- f(½) 3(½½) ½ 5 ¾ ½ 5 15/4
21
Additional Examples
- Given the function f(x) 2x2 3x 1
- evaluate f(a), f(-a), f(ah) and f(ah) f(a)
/ h - f(a) 2a2 3a 1
- f(-a) 2(-a)2 3(-a) 1 2a2 3a 1
- f(ah) 2(ah)2 3(ah) 1 2a2 4ah 2h2
3a 3h 1 - we can get this answer, in part, by combining the
first and third results above to give us - (2a2 4ah 2h2 3a 3h 1 - 2a2 3a 1)/h
(4ah 2h2 3h) / h 4a 2h 3 - An astronaut weighs 130 pounds on the surface of
the Earth and her weight changes as she gains
height above the Earth as follows
- w(h) 130(3960 / (3960 h))2 where h height
in miles - what is her weight 100 miles above the Earth?
- w(100) 130(3960 / (3960 100))2 123 2/3
pounds - construct a table to illustrate her weight at
different heights from 0 to 500 miles - see the table to the right
22
Ranges and Domains
- Step-wise functions have ranges that are not
continuous - if y follows x, f(y) does not necessarily follow
f(x) - in the piece-wise function from 2 slides ago, as
we increased towards 1, the function returns
values that are slowly getting closer to 0, but
as soon as we get larger than 1, the values begin
from 1 and get larger - so there was no range between 0 and 1
- Some functions have no domain value at certain
points - this is common if the function includes a square
root or division - f(x) (1 x)½ does not have a domain of x gt 1
since you cannot take a negative square root, so
we cannot have an x that makes (1 x) negative - f(x) 1/(x(x 1)) does not have a domain of
x0 and x1 since x 0 or x 1 would give us
1/0 which does not exist - Notice that with the definition of a function
being that of a mapping from domain to range - every input x has only 1 value f(x), this will
have implications when we look at graphs of
functions
23
Examples
- Find the domain of each function
- f(x) 1/(x2 x) 1/(x(x-1))
- the function does not exist when x 0 and x 1,
so the domain is - g(x)
- here, the function only exists when 9 lt x2
- since we cant take the square root of a negative
number - so the domain is x -3 lt x lt 3
- h(t)
- here, the function exists when the denominator is
not 0 (when t -1) and when the value under the
square root is positive (t gt -1) - these can be combined so that the domain is t
t gt -1
24
Four Ways to Represent Functions
- Verbally
- P(t) is the population of the world at time t
- not very helpful mathematically
- Algebraically
- A(r) pr2
- the algebraic representation of a function can
give us very precise values - Visually (by graph)
- often automatically produced and useful for the
human eye if not for a computer - examples speech waveforms, earthquake
seismographs, EKGs of brain waves - Numerically
- by using a table to describe the mapping, this is
helpful when the functions range is not
continuous - for example, a tax table mapping income to a
persons income tax amount
25
2.2 Graphs of Functions
- The graph of a function is similar to the graph
of an equation, as we covered in section 1.8 and
1.9 - Formally, the graph of a function is the set of
ordered pairs of points (x, f(x) x in set A - The graph however is the sketch of those points
- Example f(x) x2
Recall that there is exactly one f(x) for every
x, when we have a graph, that means that we will
find exactly one location for every
x-coordinate, therefore the sketch below is not
of a function since there is more than 1 value
for some of the x-coordinates!
26
Some Sample Graphs of Functions
27
Linear Functions
- A linear function is a special type of function
whose form is f(x) mx b - m is known as the slope as defined last chapter
- we also refer to the slope as the rise over the
run because the computation of slope is the
distance vertically or along the y-axis (known as
the rise) divided by the distance horizontally or
along the x-axis (known as the run)
- b is known as the y-offset because it denotes the
location on the y-axis of the graph when x 0 - if m 0, then there is no slope, this is a
horizontal line located at y b, and is referred
to as a constant function since the functions
value does not change no matter what x is - two linear functions are drawn to the right, y
2x 1 and y 3.
28
Piece-wise Graphs
f(x) x This means f(x) is the greatest
integer less than or equal to x so f(-4.999)
-4 and f(4.999) 5
29
Graphs of Power Functions
- A power function is a function f(x) xn for some
n as a positive integer (e.g., 2, 8, 100) - graphs of power functions are interesting in that
if n is even, the shape is similar no matter what
n is
- or if n is odd, the shape is similar no matter
what n is - recall f(x) x2 is a parabola, f(x) x4 is the
same shape, just at a more acute angle - To the left are f(x) x4 in green and f(x) x6
in red - All functions xn for an even n will yield the
parabola shape with f(x) always being positive - To the right are f(x) x3 in red and f(x) x5
in green - All functions xn for an odd n will yield the
squiggly shape going from negative to positive,
for n1, the line is straight, but it still goes
negative to positive
30
Example
- Find the domain and range using the graph of a
function - f(x)
- the graph on the right shows that the domain
exists only between -2, 2 and the range is 0,
2 - we can infer this as well because the function
cannot take any value that makes the square root
negative, so the only values of x must be between
-2 and 2 - by trying various values between -2 and 2, we can
find the range as being between 0 and 2
31
Equations that Define Functions
- Recall that a function has a unique value for
every x coordinate - However, the resulting value of the function does
not have to be unique - consider f(x) x2, f(-1) f(1)
- What this means in practice is that each x value
on a functions graph will have only 1 associated
y-value, but y-values can be repeated for many x
values
- So a vertical line drawn onto a graph that
intersects the graph at most once is a graph of a
function or, if you can draw a vertical line
anywhere on a graph and intercept the curve of
the graph more than once, then the graph is not a
function - Example circles are not functions the circle
to the right has a vertical line that intersects
it twice - y x2 2 is an equation that defines a function
but x2 y2 4 does not
32
More Functions Graphed
In red, f(x) square root(x) In green, g(x)
cubed root(x) notice that g(x) exists when x
lt 0 but f(x) does not
In red, f(x) 1 / x In green, g(x) 1 /
x2 Notice that g(x) is symmetrical about y and
f(x) is symmetrical about the origin, and
neither exists at x 0
see page 164 for other examples
Recommended
CrystalGraphics Presentations


