
Environmental monitoring applications exhibit high spatial variations and heterogeneity - PowerPoint PPT Presentation
1 / 41
Title:
Environmental monitoring applications exhibit high spatial variations and heterogeneity
Description:
Environmental monitoring applications exhibit high spatial variations and heterogeneity – PowerPoint PPT presentation
Number of Views:273
Avg rating:3.0/5.0
Title: Environmental monitoring applications exhibit high spatial variations and heterogeneity
1
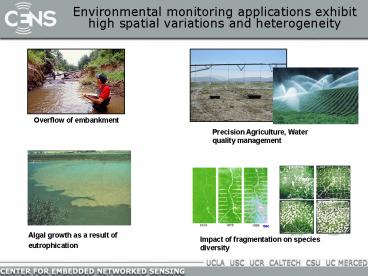
Environmental monitoring applications exhibit
high spatial variations and heterogeneity
Overflow of embankment
Precision Agriculture, Water quality management
Algal growth as a result of eutrophication
Impact of fragmentation on species diversity
2
Remote and In Situ Sensing
- Remote sensing transformed observations of large
scale phenomena - In situ sensing transforms observations of
spatially variable processes in heterogeneous and
obstructed environments
Red Soil Green Vegetation Blue Snow
SPOT Vegetation Daily Global Coverage SWIR 3 Day
Composite
Predicting Soil Erosion Potential Weekly MODIS
Data
Sheely Farm 2002 Crop map
San Joaquin River Basin Courtesy of Susan
Ustin-Center for Spatial Technologies and Remote
Sensing
3
In Situ Sensing
- Micro-Sensors and Embedded sensor networks are
bringing about a paradigm change Spatially dense
and temporally continuous, autonomous, in situ
observational capabilities will reveal the
previously unobservable. - The in situ observations will be fused with and
focused by regional/global observations
Temporal Granularity
Fine
Embedded NetworkedSensing
Manual
Spatial Granularity
Manual
Course Fine
Wide Narrow
Span
Remote Sensing
4
Down-scaling of sensors and network systems
- Biosensors, chemical sensors, actuators, imagers,
tags and mote platform types are under
development enabling close-up sensing with
increased reliability and at reduced energy
costs - Challenges
- Physical environment is dynamic and unpredictable
- Small wireless nodes present stringent energy,
storage, communication constraints - Deployment, maintenance, calibration, data
integrity for large distributed systems
5
Up-scaling from dense measurements
- Up-scaling from dense array measurements will be
accomplished via in-network techniques automated
video content classification, and data
visualization using Geographic Information
Systems - Scaling limitations mandate in-network processing
and filtering of data close to sensor source - Embedded nodes must collaborate to report
interesting spatio-temporal events
6
The network is the sensor!
- Requires large distributed systems with adaptive
internal behavior that can report spatio-temporal
events, and characterize phenomena, not just
return individual temporal and spatial data
points.
Model basedanomalydetection drivesadditional da
ta/sample collection, fieldobservation
7
Objective from data to observationsby fusing
data from multiple scales in real time
- Satellite, airborne remote sensing data sets at
regular time intervals - coupled to regional-scale backbone sensor
network for ground-based observations - fusion, interpolation tools based on large-scale
computational models
Example identification of invasive riparian
species using HyMap (airborne hyperspectral
scanning)
images from Susan Ustin, UC Davis
8
Interactive experimental science Real time
context for data and samples
- Provide interactive access to GIS, longitudinal
data, and models in the field - Contextualize in situ observations
- Guide additional data and sample collection and
system and experiment debugging - transform physical observations from batch to
interactive process
Revolutionize continental scale observations by
enabling interactive real time tasking of
sophisticated, autonomous, in situ observations
at diverse instrumented locations
9
Technical challenges for sensor networks
Objectives
Constraints
- Embeddable sensor devices
- Robust, portable, self configuring systems
- Data integrity, system dependability
- Multiscale data fusion
- Energy
- Scale, dynamics
- Autonomous disconnected operation
- Sensing channel uncertainty
- Complexity of distributed systems
- First generation systems/technology exist
- As technology matures, deployable systems will
become increasingly powerful (modalities,
precision, scale, cost)
10
Embedded sensing will benefit from technology
trends
Processor performance and cost are improving
exponentially
.but power consumption and battery capacity are
not
11
Growing technical community and industry
participation needed
- As NEON evolves it will feed off of and drive
technological development
Laboratory
Products
- Involve technologists as part of ongoing design
process - Off the shelf products dont necessarily reflect
what is possible - Laboratory results dont necessarily reflect what
is practical - Need to drive and exploit technical innovations
while being grounded in what is achievable, and
when - Growing industry base
- Intel, Crossbow, Agilent, Sun, IBM, Microsoft
12
Heterogeneous systems will helpbridge objectives
and constraints
- Widely distributed static nodes (smart dust)
- Limited energy and sampling rate
- Simultaneous, continuous in time, but costs limit
spatial density - Microservers
- Provide computational, storage, and communication
resources - Execute in-network processing, event detection,
system monitoring, tasking and gathering - Mobile and actuated nodes
- Articulation magnifies effective sensor range
- Infrastructure supported mobility enables sensor
diversity location, type, duration - Enable adaptive, fidelity-driven, 3-D sampling
and sample collection
Figure courtesy of Bill Kaiser
13
Application-Driven (not Application-Specific)Comm
on System Software
Localization Time Synchronization
Self-Test
In Network Processing
Programming Model
Routing and Transport
Event Detection
- Reusable, Modular, Flexible, Well-characterized
Services/Tools - Routing and Reliable transport
- Time synchronization, Localization, Self-Test,
Energy Harvesting - In Network Processing Triggering, Tasking, Fault
detection, Sample Collection - Programming abstractions, tools
- Development, simulation, testing, debugging
14
Towards Embedded Cyber-infrastructure
- Embeddable Devices
- Energy-conserving platforms, radios
- Miniaturized, autonomous, sensors
- Standardized software interfaces
- Deployed systems in support of
- engineering and science applications
- Environmental, Civil, Bioengineering
- Bio and Geo Sciences
- Collaboration
- NSF CISE and Engineering systems, technology
- NSF Science Directorates apply and test
systems (Bio, Geo, Env Engineering) - Other agencies and industry extend
systems(EPA, FDA, DOE, DHS, DOD, )
Embedded Cyberinfrastructure will provide common
middleware to define and control experiments, and
common data management standards to support the
analysis, synthesis and fusion of what has
previously been disparate and incompatible data
sources.
15
For Further Investigation
- Center for Embedded Networked Sensing,
http//cens.ucla.edu - NSF Workshops including Sensors for Environmental
Observatories, http//www.wtec.org/seo/seo6.htm - Biosensing overview, http//www.wtec.org/biosensin
g/proceedings/ - National Ecological Observatory Network,
http//neoninc.org - TInyOS and Mote platforms UC Berkeley, Intel,
Crossbow, Sensicast, Dust Networks, Ember - Principles of Embedded Networked Systems Design,
Gregory J. Pottie and William J. Kaiser,
Cambridge University Press, Spring 2005
16
Embedded Sensor Networks for NEON
Deborah Estrin UCLA and Center for Embedded
Networked Sensing (CENS) Work summarized here is
largely that of students, staff, and other
faculty at CENS We gratefully acknowledge the
support of our sponsors, including the National
Science Foundation, Intel Corporation, Sun Inc.,
Crossbow Technologies Inc., participating
campuses.
17
CENS example precision agriculture
Overview
- concept of embedded networked sensing in support
of precision agriculture focused on environmental
protection - building scaleable nitrate microsensors
- laboratory results and limitations
- multiscale networked sensing
- 1D sensor network
- 3D sensor network
- Remote sensing/data assimilation
18
Wastewater reuse in the Mojave Desert
- Where does the County Sanitation District (CSD)
of Los Angeles put 4 million gallons per day of
treated wastewater in a landlocked region? - Stakeholders
- County Sanitation District
- Farmer
- Water Quality Board
19
Distributed monitoring and adaptive management
approach
image by Jason Fisher (Cal-CLEANER)
- Monitoring network design
- How many sensors can we get away with?
- How do we optimally place them?
- Interpolating between sensors
- Distributed parameter models
- Stochastic approaches
- Remote sensing/data assimilation
20
Sensor fabrication scaling and form factor
- Off-the-shelf nitrate sensors exist, but they are
relatively large and expensive - potentiometric sensors are relatively easy to
fabricate, and should scale down well - packaging is another issue
- getting the right form factor
- environmental resiliency
- cost-longevity-data quality issues
Micron-scale nitrate ISE
Drawing courtesy of Bill Swenson and Michael
Allen, UC Riverside
21
Potentiometric Measurements
ISE characteristics
Slope ? 59.2 mV change for each conc. log cycle
(monovalent ions)
Advantages of this approach 1) simple 2) power
for data transmission only 3) scales down
22
nitrate microsensor
Graphite carbon fiber-based ion selective
electrode (ISE)
23
mini-nitrate sensor--a single carbon fiber
7 mm carbon fiber
Bendikov, Kim and Harmon, IEEE Sens. Act. B
Chemical, 2005
24
Comparative nitrate sampling in soil moisture
- 1st split of core sample
- extract soil in water
- analysis by Griess-Romijn method (Hach reagent
kit) - 15-20 min/sample
- 2nd split of core sample
- direct measure by contact with nitrate
microsensor - 5-10 sec/sample
Soil surface
1ft
3ft
5ft
7ft
9ft
Soil samples
25
Comparative soil moisture sampling
- Microsensor results
- higher concentrations at given depth
- significant variation point-to-point at a given
depth - in absolute terms, 1000s mg/L accumulating due to
evaporation (vs 100s using conventional method) - Moisture regime
- sensor requires continuous moisture (greater than
10 vol for this fine/medium sand)
26
Limitations
- Limit of detection roughly 2 ppm (125 mM)
- carbon fibers are brittle (packaging design)
- sensors fail after 6-8 weeks
- alternative fabrication materials?
- amperometric approach (Jack Judy, UCLA)
- IC-on-a-Chip (Yu-Chong Tai, Caltech)
- reference electrode not yet miniaturized
- polyurethane-based model should scale down (Lee
et al., Anal. Chem. 1998)
27
Scaling up to the field...
At 100-200/sensor, how many can we really
afford to deploy? Current off-the-shelf sensors
will suffice for test beds Ultimately, sensors
need to be more scaleable to address
heterogeneous domains
28
Step1 Scaling up to 1D sensor nodes (where we
are now in the field)
- Each node includes an array of sensors
- For example moisture, temperature, nitrate
sensors - Centralized computing identifies effective
transport parameters - Local processing can identify triggering events
(e.g., collaboration among nodes triggers
recalibration.) - The multimodal node becomes a more informative
virtual sensor
Silty sand
clay
Rotating pivot
29
Sensor suite in the soil pylon
Nitrate ISEs (ISE Vernier, Sentek, Denver
Instruments)
also Davis rain gauge, thermistors
Decagon soil moisture sensor (longevity?)
Pylon
30
In situ calibration
- How does the sensor response change with
embeddedness (teasing out artifacts)? - Absolute position, response relative to potential
obstructions, flow diversions is difficult to
control
31
Near Real-Time Adaptive Management System
Palmdale wireless sensor network system
MICA2 mote (transceiver), MDA300 (DAQ)
Stargate PCMCIA (gateway)
wireless
Wireless data
Server (mySQL) simulation, management models
Irrigation control
Sensors
Optimal app. rate
32
pylon communications hardware
Mica2 Mote
Stargate PCMCIA card (gateway)
MDA300 DAQ board
pylon
33
Application of RHFC to Palmdale
Periodic irrigation boundary condition
Optimization Problem Formulation (Receding
horizon feedback control)
(1) begin with sensors indicating initial soil
conditions (2) optimize application rate subject
to moisture content constraints (NLP) (3) apply
optimal rate (4) receive feedback from
sensors (5) re-optimize
34
Model Calibration (1D unsaturated flow)
Model fit to sensor (TDR) data (not real-time)
35
RHFC Preliminary Results (micromanaging)
management step (6 h) (lt irrigation cycle)
36
RHFC Preliminary Results (micromanaging)
management step (10 h) (gt irrigation cycle)
37
3D deployment in a heterogenous domain
30 acre test plot
1ft
3ft
5ft
7ft
9ft
core collection
23 Borehole Sampling Locations (total 105 Cores)
Field support by Jose Saezs corps of Loyola
Marymount University undergrads is gratefully
acknowledged
38
Soil Sampling Plan --gt Sensor network design
Kriging variance maps with optimal additional
sampling points (courtesy of Dr. Juyoul Kim, UCLA)
39
Variability geostatistics, simulations and
sensor network design and calibration
- At the field scale
- rigorous characterization sampling still
required - geostatistical parameterization techniques
- Report network information and associated
uncertainty - Iteration between models and sensor perpetually
to decrease uncertainty
indicator kriging (probability Ks
exceeds...)
ordinary kriging (Ks)
40
Data integrity in sensor networks multilevel
calibration
- Bench-top calibration
- Pilot deployment
- develop in situ calibration protocol
- characterize longevity, degradation
- Early in the deployment
- Take advantage of the sensors integrity
- Calibrate model (distributed parameters)
- Integrate DAQ with simulator to accelerate
process - Later (as sensors become suspect)
- Reverse the process
- Let the network identity bad sensors
- Incorporate uncertainty into the process
41
Summary and Conclusions
- Each assemblage of literal sensors combines to
create a higher level virtual sensor (the network
is the sensor!) - Scaleable sensors value of the sensor vs. value
of the data desired - Scaling up to a multisensor node is a key step
- in situ calibration, system robustness, ...
- 3D network design is a diffcult challenge
- traditional characterization methods
- monitoring network design algorithms
- ENS will enable closing the loop (initial human
design, deployment followed by autonomous
calibration, verification, forecasting...
Recommended
CrystalGraphics Presentations


