
Mike%20Ritzwoller PowerPoint PPT Presentation
Title: Mike%20Ritzwoller
1
Resent Results in Ambient Noise Tomography
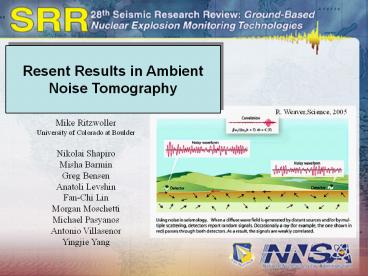
R. Weaver,Science, 2005
Mike Ritzwoller University of Colorado at
Boulder Nikolai Shapiro Misha Barmin Greg
Bensen Anatoli Levshin Fan-Chi Lin Morgan
Moschetti Michael Pasyanos Antonio
Villasenor Yingjie Yang
2
Outline
- Simulations to illustrate the idea behind Ambient
Noise Tomography (ANT). - Description of the data processing procedure.
- Early application of ANT in S. California 7.5 -
18 sec. - Update on this work across the W. US using
EarthScope Transportable Array data. - Examples of other applications elsewhere.
- Frontier Issues
- phase velocities
- 3-D model construction
- source of ambient noise
- China
3
The Idea of the Method
Set-up of the Simulation 2 stations
4
The Idea of the Method
Add a source
5
The Idea of the Method
Add a source Zoom around receivers
6
The Idea of the Method
1
2
2
time (sec)
1
time (sec)
7
The Idea of the Method
Add another source randomly
1
2
2
time (sec)
1
time (sec)
8
The Idea of the Method
Two sources in line with the stations
1
2
2
time (sec)
1
time (sec)
9
The Idea of the Method
2
time (sec)
1
2
1
time (sec)
Green function for propagation between the
stations.
cross- correlation
lag (sec)
10
The Idea of the Method
Map the tendency for constructive
interference between nearby events.
grad (differential travel
time) min along outside the receivers
max between receivers
11
The Idea of the Method
Azimuthally homogeneous distribution of sources
1000s of sources, over 30 days
2
time (sec)
1
time (sec)
12
The Idea of the Method
Azimuthally homogeneous distribution of sources
1000s of sources, over 30 days
cross-correlation
lag (sec)
13
The Idea of the Method
Azimuthally homogeneous distribution of sources
1000s of sources, over 30 days
cross-correlation
lag (sec)
theoretical Green function
14
The Idea of the Method
Azimuthally inhomogeneous distribution of sources
1000s of sources, over 30 days
cross-correlation
lag (sec)
lag (sec)
lag (sec)
theoretical Green function
15
Outline
- Simulations to illustrate the idea behind Ambient
Noise Tomography (ANT). - Description of the data processing procedure.
- Early application of ANT in S. California 7.5 -
18 sec. - Update on this work across the W. US using
EarthScope Transportable Array data. - Examples of other applications elsewhere.
- Frontier Issues
- phase velocities
- 3-D model construction
- source of ambient noise
- China
16
Data Processing Procedure
Phase 1. Pre-processing of single-station
data. ? Remove instrument, mean, trend,
band-pass filter, cut to 1-day. ? Time-domain
normalization desensitize to earthquakes
instrumental irregularities. ? Spectral
whitening.
Phase 2. Processing on station-pairs. ?
Cross-correlation one day at a time. ? Stack
daily cross-correlations.
17
Data Processing Procedure
Phase 2. Processing on station-pairs
cross-correlation and stacking. ? Emergence of
the signal with stacks of increasing length.
18
Data Processing Procedure
Phase 2. Processing on station-pairs
cross-correlation and stacking. ? Emergence of
the signal with stacks of increasing length.
Data from North America
19
Data Processing Procedure
Phase 2. Processing on station-pairs
cross-correlation and stacking. ? Result of
following the processing procedure and stacking
over long time series.
20
Data Processing Procedure
Phase 3. Measure dispersion curves.
Path N. Germany to N. Italy
21
Data Processing Procedure
Phase 4. Error analysis and measurement
selection. ? Only high SNR observations are used.
HRV - PFO, 12 months
22
Data Processing Procedure
Phase 4. Error analysis and measurement
selection. ? Only high SNR observations are used.
12 month stacks from North American stations
23
Data Processing Procedure
Phase 4. Error analysis and measurement
selection. ? Only high SNR observations are
used. ? 3 wavelength inter-station distance
period cut-off (distance/10). ? Measurements are
repeatable -- basis for error analysis.
Path Holland to Hungary
24
Data Processing Procedure
Phase 4. Error analysis and measurement
selection. ? Only high SNR observations are
used. ? 3 wavelength inter-station distance
period cut-off (distance/10). ? Measurements are
repeatable -- basis for error analysis. ?
Measurements cohere as a set -- determined during
tomography.
25
Outline
- Simulations to illustrate the idea behind Ambient
Noise Tomography (ANT). - Description of the data processing procedure.
- Early application of ANT in S. California 7.5 -
18 sec. - Update on this work across the W. US using
EarthScope Transportable Array data. - Examples of other applications elsewhere.
- Frontier Issues
- phase velocities
- 3-D model construction
- source of ambient noise
- China
26
Transportable Array (August, 2004) 62
stations
27
Short period ( 6 - 20 sec) surface wave
tomography across California
One month stack Aug 03 Measurements
retained SNR gt 10 /- lags consistent 62
stations BDSN, TriNet, Anza, TA 0.25 deg
grid Background model CUB Ray tomography Maps
at 7.5, 15, 18 sec.
28
dispersion maps
high resolution tomography of the Californian
crust from ambient seismic noise
Central Valley
Ventura basin
Imperial Valley
LA basin
29
dispersion maps
high resolution tomography of the Californian
crust from ambient seismic noise
Sierra Nevada
Sacramento basin
Franciscan formation
Peninsular Ranges
Salinean block
San Joaquin basin
30
Outline
- Simulations to illustrate the idea behind Ambient
Noise Tomography (ANT). - Description of the data processing procedure.
- Early application of ANT in S. California 7.5 -
18 sec. - Update on this work across the W. US using
EarthScope Transportable Array data. - Examples of other applications elsewhere.
- Frontier Issues
- phase velocities
- 3-D model construction
- source of ambient noise
- China
31
Current Status of the Transportable Array
Sept 16, 2006
Courtesy of the EarthScope Array Network
Facility, UCSD anf.ucsd.edu
32
Resolution 8 sec
Oct, 2004 - July, 2006
Oct, 2004
33
Group Velocity 8 sec
Oct, 2004 - July, 2006
Oct, 2004
34
Group Velocity Oct 2004 - Jul 2006
16 sec
24 sec
35
Outline
- Simulations to illustrate the idea behind Ambient
Noise Tomography (ANT). - Description of the data processing procedure.
- Early application of ANT in S. California 7.5 -
18 sec. - Update on this work across the W. US using
EarthScope Transportable Array data. - Examples of other applications elsewhere.
- Frontier Issues
- phase velocities
- 3-D model construction
- source of ambient noise
- China
36
Examples of Applications Elsewhere
- Europe (VEBSN)
- Yang, Y., M.H. Ritzwoller, A.L. Levshin, and
N.M. Shapiro, Ambient noise Rayleigh wave
tomography across Europe, Geophys. J. Int., in
press. - Spain (SNN)
- Villasenor, A., M.H. Ritzwoller,
and Y. Yang, Ambient noise tomography across
Spain using the Spanish National Network,
Geophys. Res. Lett., in preparation. - 3. New Zealand (GeoNet)
- Lin, F., M.H. Ritzwoller, J. Townend, M.
Savage, S. Bannister, Ambient noise Rayleigh wave
tomography of New Zealand, Geophys. J. Int.,
submitted. - South Korea (accelerograph network, high
frequencies) - Cho, K.H., R.B. Hermann, C.J. Ammon, and K.
Lee., Imaging the upper Ccust of the Korean
Peninsula by surface-wave tomography, Bull.
Seism. Soc. Am., submitted. - Kang, T.S. and J.S.Shin, Surface-wave tomography
from ambient noise of accelerograph networks in
southern Korea, Geophys. Res. Lett., 33, 2006. - 5. Tibet (PASSCAL experiment)
- Yao, H., R. D. van der Hilst, and M.V. de Hoop,
Surface-wave tomography in SE Tibet from
ambient seismic noise and two-station analysis
-- I. Phase velocity maps, Geophys. J. Int., 166,
2006. - Seafloor (OBS installation)
- Harmon, N., D. Forsyth, and S. Webb, Using
ambient noise to determine short period phase
velocity and shallow shear velocities in young
oceanic lithosphere, in preparation.
37
Group Speed Tomography Across Europe
- I. Data processing was procedure applied
- to the 12-months of VEBSN data across Europe for
2004. - II. Data processing was followed by
- tomography to produce dispersion
- maps 8-50 sec period.
125 stations
Stations from the Virtual European Broad-Band
Seismic Network (VEBSN).
38
Group Speed Maps Across Europe 16 sec
From CUB 3-D Model
39
Group Speed Maps Across Europe 16 sec
Ambient Noise Tomography
16 sec
3241 paths
40
Group Speed Maps Across Europe 30 sec
From CUB 3-D Model
41
Group Speed Maps Across Europe 30 sec
Ambient Noise Tomography
2450 paths
42
How do we Know if These Results are an
Improvement Over Traditional Earthquake
Tomography?
Various lines of evidence
- Agreement with known structures.
- e.g., sedimentary basins, crustal thickness.
- Repeatability of measurements.
- Seasonal variability is the basis for
uncertainty estimates on the measurements. - Coherence of measurements.
- Fit to ambient noise measurements during
tomography, compared with fit to earthquake based
measurements during tomography.
43
Agreement with Location of Sedimentary Basins?
Observed 16 sec
Many of the basins across Europe are reflected in
the short period dispersion maps (e.g., 16 sec
here) N. Sea Basin, Silesian Basin (N.
Germany, Poland), Panonian Basin (Hungary,
Slovakia), Po Basin (N. Italy), Rhone
Basin (S. France),
From Crust1.0, Laske et al.
44
Smaller Scale Across Spain Using the Spanish
National Network Data
45
Smaller Scale Across Spain Using the Spanish
National Network Data
46
Smaller Scale Across Spain Using the Spanish
National Network Data
47
Smaller Scale Across Spain Using the Spanish
National Network Data
48
Agreement with Expected Crustal Thickness?
Observed 30 sec
Low speed anomalies across Europe are associated
with mountains belts, consistent with thickened
crust e.g., Alps, Balkans, Carpathians.
From Crust2.0, Laske et al.
49
Coherence Among Measurements -- 12 sec period?
As measured by the ability to fit data sets when
doing tomography..
Misfit to Earthquake Measurements From
Earthquake Tomography
Misfit to Ambient Noise Measurements From
Ambient Noise Tomography
st dev 28.9 sec
st dev 15.0 sec
misfit (sec)
misfit (sec)
50
Outline
- Simulations to illustrate the idea behind Ambient
Noise Tomography (ANT). - Description of the data processing procedure.
- Early application of ANT in S. California 7.5 -
18 sec. - Update on this work across the W. US using
EarthScope Transportable Array data. - Examples of other applications elsewhere.
- Frontier Issues
- phase velocities
- 3-D model construction
- source of ambient noise
- China
51
Frontier Issues
- Phase velocities.
- 3-D model construction joint inversion
- with other data.
- Source characterization.
- Higher frequencies, smaller scales.
- Love waves.
- Ocean bottom measurements.
- Better use of regional networks China, PASSCAL
- experiments.
52
Phase Velocities Resolving Ambiguities
Confusion
53
(No Transcript)
54
(No Transcript)
55
No phase shift
Data from Southern California 10 sec 18
sec 25 sec
56
Pi/4 phase shift
Data from Southern California 10 sec 18
sec 25 sec
57
Pi/4 phase shift
Data from Southern California 10 sec 18
sec 25 sec
58
Extension to Phase Velocities at Longer
Periods High Resolution
Mantle Constraints
25 sec Phase velocity Teleseismic 2-plane
wave method Yang Forsyth
25 sec Phase velocity Ambient noise Yang
Moschetti
59
Extension to Phase Velocities at Longer
Periods Group and Phase
Speeds Compared
25 sec phase speed
40 sec group speed
60
Inversion for a Crustal Vs Model First Results
in CA
16 sec, group velocity, 10/04-7/06
61
Inversion for a Crustal Vs Model First Results
in CA
16 sec, group velocity, 10/04-7/06
Preliminary crustal thickness
Inversion by Morgan Moschetti
62
Emerging Regional National Networks China
- CDSN 11 stations.
63
Emerging Regional National Networks China
- CDSN 11 stations.
- National Digital
- Seismograph Network
- 48 stations now
- 152 stations total
64
Emerging Regional National Networks China
- CDSN 11 stations.
- National Digital
- Seismograph Network
- 48 stations now
- 152 stations total
- 3. Regional Telemetered
- Digital Seismograph
- Networks
- 20 networks, 267 stations
- 31 networks, 678 stations
65
Conclusions
- Ambient noise tomography is rapidly developing as
a powerful new tool to produce high resolution
images of the crust and uppermost mantle
homogeneously over large regions. - Current efforts are producing information from
many new application areas and extending
research phase velocities, Love waves, 3D
inversions, OBS data, source characterization,
etc. - Emerging national and regional network data and
PASSCAL experiments are providing increasing
station resources which are the basis for the
method.
Recommended
