
Lets Eat PowerPoint PPT Presentation
1 / 80
Title: Lets Eat
1
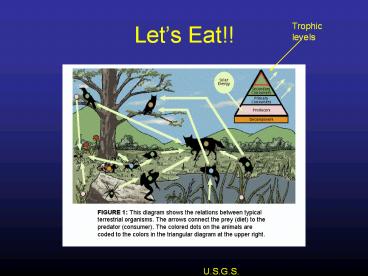
Lets Eat!!
Trophic levels
U.S.G.S.
2
What do the First and Second Laws of
Thermodynamics Tell us?
- First Law Energy in Energy Out
- Until humans
- Energy sit by fire, or in the sun
- Sun 30 reflectd, 50 converted to heat, the
rest goes to the water cycle, except lt1 used by
plants - Second Law No process is 100 efficient
- Energy In Work Heat
3
What is Ecological Efficiency?
- Plants absorb how much sunlight?
- 1-3
- Herbivores use how much of the plant energy?
- 10
- Where does the rest go?
- Heat and respiration
- What is the efficiency of a carnivore?
- 10
- Example Humans
- 0.02 x 0.1 x0.1 0.0002, 2 of the solar energy
that passed through the plant, cow, human
4
Species interaction tactics
- Unique niches
- Competition--competitive exclusion by
specialization vs. extinction - Specialization
- Symbiosis--commensalism, mutualism, parasitism
- Predation
- population ecology
5
Population Ecology
1. Density and Distribution 2. Growth a.
Exponential b. Logistic 3. Life Histories 4.
Population Limiting Factors 5. Human population
growth
(Modified from a WWW site that I have lost the
reference to!
6
Examples of applications
- Invasive species
- Endangered species
- Pest control (e.g., agriculture)
- Human population growth
7
Population. Individuals of same species occupying
same general area.
Density the number of organisms in a unit
area Distribution how the organisms are spaced
in the area
Fig. 52.2
8
Changes in population size
Northern Pintail Duck
Growing
Fig. 52.9
Shrinking
Fig. 52.16
Fluctuating
Fig. 52.19
9
Questions
- Why do populations change in size?
- What factors determine rates of population growth
or decline? - How do these differ among species?
10
2. Population Growth a. exponential growth
The change in population size (N) in an interval
of time is number of births number of
deaths, or ???
If b (birth rate) is the number of offspring
produced over a period of time by an average
individual, and d (death rate) is the average
number of deaths per individual, then ????
11
Population Growth exponential growth
The difference between the birth rate and the
death rate is the per capita growth rate ???
The growth equation can be rewritten as ???
Exponential growth occurs when resources are
unlimited and the population is small (doesnt
happen often). The r is maximal (rmax) and it is
called the intrinsic rate of increase.
12
Population Growth exponential growth
- Note that
- r is constant, but N grows faster as time goes
on. - What happens with different rs in terms of total
numbers and time to reach those numbers?
Fig. 52.8
13
r can also be negative (population
decreasing) if r is zero, the population does
not change in size thus, the rate of increase
(or decrease) of a population can change over
time.
14
Exponential growth does not happen often
Fig. 52.9 Whooping crane
15
Or indefinitely
Reindeer on the Pribalof Islands, Bering Sea
reindeer slide
16
Unlimited growth, carrying capacity, and limited
growth
17
Models of population growth
- This is the simplest model of population growth
for species with discrete breeding seasons. - In this model, there is no competition, and
population dynamics are governed solely by the
net reproductive rate, R. - If R gt 1, the population increases indefinitely
and exponentially.
Nt1 NtR Or Nt N0Rt
18
Models of population growth incorporating
competition
- Graphically, we can see that the population
increases exponentially when Nt is very low. - But the rate of increase declines as population
size rises. - At carrying capacity, the growth rate is zero.
- Above carrying capacity, the population will
decline. - K is therefore a stable equilibrium.
19
St. Matthew Island, Alaska
20
Reindeer on St. Matthew Island, Alaska
- In 1944, 29 reindeer introduced to St. Matthew
Island (300 km2) - Approximate initial density 0.1/km2
- 24 females, 5 males, all 2 years old
21
Reindeer on St. Matthew Island, Alaska
- R. Rausch visited the island in 1954, and on the
basis of counts, estimated the population size at
400-500. - C.J. Rhode visited the island in 1955, and
estimated the population size at 700-900.
22
Reindeer on St. Matthew Island, Alaska
- David Klein visited the island in 1957, and made
a total count of 1,350 animals. - This implies an average annual growth rate of 34
percent. - Klein assumed that the population growth rate
earlier in the explosion must have been near the
theoretical maximum for the species.
23
Reindeer on St. Matthew Island, Alaska
- Population growth during this period looks like
unlimited growth. - Klein recognized the potential importance of this
study during his 1957 visit.
24
Natural mortality was assessed from skeletons
25
Physical condition was assessed from animals shot
during fieldwork
26
Physical condition was assessed from animals shot
during fieldwork
27
Physical condition was assessed from animals shot
during fieldwork
28
At a density of 4.5 inds./km2, the animals were
in excellent condition
- Noticeable, extensive fat deposition, especially
on large males - Weights of all reindeer collected exceeded the
average weight range for other Alaskan reindeer - No external parasites noted
- Very large and uniform antler growth on males and
females
29
What contributed to the unlimited growth and
excellent condition of reindeer on St. Matthew
Island?
- Abundant winter and summer forage
- No competitors
- No large predators
- No large herbivores had been there previously
- But Klein sensed there was trouble on the horizon
30
Signs that limits to population growth were
imminent in 1957
- Lichen beds were showing signs of fracturing due
to overgrazing and trampling (winter range) - Prostrate willows were also showing signs of
heavy browsing (summer range) - Calf percentage of 26 was below the indicated
level of previous years - Klein concluded/warned that the population
decline may be rapid after the peak is reached.
31
What happened next
- Klein revisited the island in 1963 and surveyed
it with 2 Coast Guard helicopters. - As their boots hit the shore, they saw reindeer
tracks, reindeer droppings, bent-over willows,
and reindeer after reindeer. Ned Rozell,
Alaska Science Forum - The survey revealed the population had increased
to 6000 - Calf percentage was lower than in 1957
- Recruitment was down from 29 in 1957 to 17 in
1963 - There was ample evidence of overpopulation, and
the stage was apparently set for wholesale
die-off.
32
What happened next
- May 1964 an aerial survey of the island located
no reindeer. We were unaware, of course, that a
die-off had already taken place.
33
The introduction, increase, and crash of reindeer
on St. Matthew Island Klein, D.R. 1968. J.
Wildl. Manage. 32350-367.
- Upon returning in 1966, Klein found only 42
reindeer - Of these, 1 male the rest were females 2yrs old
and older - No calves or yearlings, indicating the crash
die-off probably occurred in late winter 1964.
34
What caused the crash die-off?
- Extremely high density (20/km2)
- Unusually harsh winter in 1963-64 (exceptionally
cold, with unusually deep snow) - Long bones of examined skeletons contained no
marrow fat, indicating starvation - Many skeletal remains were found in groups,
suggesting the animals died over a very short
period. - By the mid 1980s, there were 0 reindeer on the
island.
35
Sex and age composition of the die-off
36
Compare natural mortality (1957) with crash
die-off (1966)
37
- Physical characteristics of the animals in 1957
and 1963 - Avg body weight declined by 38 for adult females
and by 43 for adult males - Not only were they smaller just before the crash,
regressions between body weight and skeletal
parameters indicated growth rates were lower in
1963 - Lichens had been completely eliminated as a
significant component of the winter diet
38
Carrying capacity
- Klein (1968) suggested that forage quantity
primarily governs population size, while quality
determines the size of the individual. - The winter component governs the upper limit of
the population, and the summer component
determines the stature of the individual.
39
Klein (1968) attributed the large-scale die-off
to the following factors
- Overgrazing of lichens, with no possibility of
the reindeer expanding into alternative range - Excessive density of reindeer competing for a
very restricted winter resource - Relatively poor condition of reindeer going into
the winter of 1963, resulting from intense
competition - Extreme weather conditions, primarily deep snow,
during the winter of 1963-64.
40
Intraspecific competition and carrying capacity
- Competition may be defined as (Begon et al.
1984) - An interaction between individuals, brought about
by a shared requirement for a resource in limited
supply, and leading to a reduction in the
survivorship, growth, and/or reproduction of the
competing individuals.
41
Effects of competition on individuals
- Increased energy expenditure (searching for the
unexploited resource), increased risk of
mortality, and decreased rate of food intake may
all decrease individuals chances of survival
42
Effects of competition on individuals
- Increased energy expenditure and decreased food
intake may leave less energy available for
development and less available for reproduction. - Increases in density will therefore decrease the
contribution made by each individual to the next
generation.
43
Common features of intraspecific competition
- The ultimate effect of competition is a decreased
contribution to the next generation - Intraspecific competition leads to decreased
rates of resource intake per individual,
decreased rates of individual growth or
development, or to decreases in the amounts of
stored reserves - These may lead to decreases in survival and/or
fecundity. - Evidence from St. Matthew Island?
44
Common features of intraspecific competition
- The resource for which individuals compete must
be in limited supply - Competing individuals might or might not interact
directly - Exploitation competition occurs when individuals
remove an item needed by others - Interference competition occurs when individuals
interact directly and prevent others from
occupying a portion of habitat and exploiting its
resources - Which type presumably occurred on St. Matthew
Island?
45
Common features of intraspecific competition
- The competing individuals are in essence
equivalent, but in practice they are not - One-sided reciprocity or Asymmetric
competition - The effects of competition are not the same on
all individuals in the population - Evidence of asymmetry on St. Matthew Island?
46
Common features of intraspecific competition
- The likely effect of competition on any
individual is greater the more competitors there
are. - The effects of intraspecific competition are thus
said to be density dependent.
47
Logistic Growth Equation incorporates changes in
growth rate as population size approaches
carrying capacity.
dN rmaxN dt
(K - N) K
Fig. 52.10
48
(No Transcript)
49
(No Transcript)
50
At what point is the effective r the
highest? At what point are the most individuals
added to the population? Are these the same?
51
Logistic Model
Fig. 52.12
Fits some populations well, but for many there is
not stable carrying capacity and populations
fluctuate around some long-tem average density.
52
3. Life Histories
- How do we figure out r for different populations?
- What accounts for different patterns or rates of
population growth among different species? - For example, different rmax
53
How do we figure out r?
a. Life History Tables follow a cohort from
birth until all are dead.
life history table
54
Reproduction Tables follow a cohort from birth
until all are dead.
55
b. Life history strategies
Life histories are determined by traits that
determine when and how much an organism
reproduces and how well it survives.
56
b. Life history strategies i. reproduction
big-bang reproduction
Vs. reproduction for consecutive years
fewer young produced per event but often more
parental care
very high reproductive rates per event
57
b. Life history strategies ii. mortality
Survivorship curves
Fig. 52.3
58
There are often trade-offs between reproduction
and survival.
Fig. 52.6 - European kestrel
59
Reproduction has a cost when energy is limiting.
Fig. 52.5 Red deer in Scotland
60
3.b. Life history strategies iii. r- and
K-selection
K-selection
Near carrying capacity natural selection will
favor traits that maximize reproductive success
with few resources (high densities). Density-depe
ndent selection.
r-selection
Below carrying capacity natural selection will
favor traits that maximize reproductive success
in uncrowded environments (low densities). Densit
y-independent selection.
61
food availability, territories, water, nutrients,
predators/parasites/disease, waste accumulation
weather events, salinity, temperature
62
Density dependent decreased fecundity
Food-limited
Space-limited
Fig. 52.14
63
Density dependent decreased survivorship
Fig. 52.15
64
Density-dependent changes in birth and death
rates slow population increase. They represent
an example of negative feedback. They can
stabilize a population near carrying capacity.
Fig. 52.13
65
4. Factors that limit population growth
- Density dependent birth and death rates (as we
just discussed). Many of these reflect - competition for resource (food/energy, nutrients,
space/territories). - predation, parasites, disease
- waste accumulation (e.g., ethanol)
66
4. Factors that limit population growth
- Density independent survivorship or mortality
- Extreme weather events
- Fluctuations in wind and water currents
67
Interactions among population-limiting factors
The dynamics of a population result from the
interaction between biotic and abiotic factors,
making natural populations unstable.
Water temperature, Competition, Cannibalism.
Fig. 52.18
68
Population-Limiting Factors
Some populations have regular boom-and-bust
cycles.
Predation Food shortage in winter
Prey availability
Fig. 52.19
69
SUMMARY
Population. Individuals same species occupying
same general area.
Have geographic boundaries and population
size. Key characteristics Density.
Individuals per unit of area or volume.
Distribution uniform, clumped, random.
Demography. Studies changes in population size.
Additions () Births and Immigration. Subtrac
tions (-) Deaths and emigration.
Life histories. Affect reproductive output and
survival rate and thus population growth.
Life history strategies are trade-offs between
survival and reproduction.
70
Population Growth Exponential. J-shaped.
Idealized, occurs in certain conditions.
Logistic. S-shaped. A little more realistic.
Carrying capacity. K-selection.
Density-dependent selection. r-selection.
Density independent selection.
Population growth is slowed by changes in birth
and death rates with density. Interaction of
biotic and abiotic factors often results in
unstable population sizes. In some populations
they result in regular cycles.
71
6,417,531,489 people (as of 930, Feb. 8, 2005)
5. Human population growth
72
Questions
- 1. Human growth
- For example,
- What factors are correlated with changes in human
population growth rate? - How long has Earths population been similar to
what it is now? - Over what time period has the human population
shown the greatest change in numbers? - 2. How do the patterns compare with what we have
just studied about natural patterns of population
growth? - 3. What new questions does this raise for you?
73
Human Population 6,339,110,260 (this morning)
Exponential growth since Industrial Revolution
better nutrition, medical care and sanitation.
Growth rates ( r ) 1963
2.2(0.022), 1990 1.6, 2003 1.3
(200,234/day), 2015 1
http//www.ibiblio.org/lunarbin/worldpop
Growth will slow down either due to decreased
births or increased deaths. Likely both as
suggested by age-structure pyramids relative
number of individuals in each age-class.
Fig. 52.20
74
Age-structure pyramids
Fig. 52.22
75
BELLINGHAM
CensusScope
76
When and how will human population growth stop?
- This question is likely to be answered one way or
another in your lifetime. - What is Earths carrying capacity for humans?
- Have we already exceeded K?
- What are consequences of human population growth
for other species on this planet?
77
Human impact
- Depends on
- Total human population
- Consumption by each individual
- Ecological impact of each unit of consumption
- I PAT (Ehrlich and Ehrlich)
- P population
- A affluence
- T technology
78
Unknown what the carrying capacity of Earth for
humans is. A useful concept is the ecological
footprint land needed to produce resources and
absorb wastes for a given country.
World Wildlife Fund for Nature
79
Fig. 52.23 Ecological footprints for various
countries and the world
80
SUMMARY
Human population has been growing exponentially
for a long time. A reduction is expected either
through lower birth rates or higher death rates.
The age-structure suggest different scenarios for
individual countries. Humans appear to be above
Earths carrying capacity.
Recommended
