
Sample new presentation for Chicago Equity Partners
1 / 29
Title:
Sample new presentation for Chicago Equity Partners
Description:
... Tech sector trading at twice P/E multiple of any other growth sector, ... Today, Tech sector trades at a similar multiple, of around 30, with other growth ... – PowerPoint PPT presentation
Number of Views:69
Avg rating:3.0/5.0
Title: Sample new presentation for Chicago Equity Partners
1
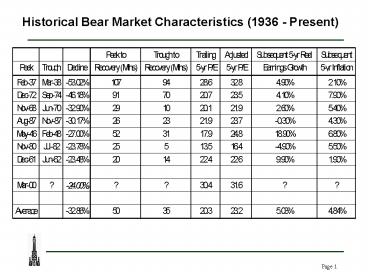
Historical Bear Market Characteristics (1936 -
Present)
2
Peak-to-Recovery Time
vs.
Decline Severity (1936-Present)
100
80
60
2
R
0.8638
40
20
0
-20
-60.00
-50.00
-40.00
-30.00
-20.00
-10.00
0.00
Market Decline
3
Accessor Growth FundJuly 17, 2001Presented
byChicago Equity Partners
Michael P. Wagner Director Client Service
David C. Coughenour, CFA Managing
Director Research
4
Facts About Chicago Equity Partners
Assets Under Management March 31, 2001 7.2
Billion Clients Assets (M)
No. Corporate 2,524.3 35 Foundations
Endowments 1,008.5 31 Funds 2,258.6
4 High Net Worth 169.4 17 Public
1,021.1 12 Taft-Hartley 194.6 8
Total 7,176.5 107
Products Assets (M) Large Cap Equity
5,167.4 Mid Cap Equity 648.2 Small Cap
Equity 305.4 Customized Balanced
Accounts 986.2 Fixed Income
69.3 Total 7,176.5
People Portfolio Managers/Trading 16 Client
Service/Sales/Marketing 15
Compliance/Operations/Technology 6
Administrative 6 Total 43
5
Investment Philosophy
- Balance investment returns against client
benchmark with explicit risk parameters - Remain sector neutral
- Maintain fully invested portfolios
- Employ proprietary quantitative methods to
analyze fundamental information and identify
value in efficient markets
6
Strategy
- Goal is to add incremental value (alpha) over
benchmark by being - Disciplined
- Objective
- Consistent
Performance results are gross of fees.
7
Stock Selection
Stock Universe
- Sort by Industries
11 proprietary model factors
- Momentum factors
- Estimate momentum
- Earnings surprise
- Downward earnings revision
- Upward earnings revision
- Earnings Change
- Value factors
- P/E ratio
- Price/book ratio
- Cash flow
- Dividend discount model
- Quality factors
- Forecasted earnings dispersion
- Leverage
Model Output
Stock Ranking by alpha
8
Stock Ranking within Industry by Forecasted Return
Highest
Buy
30
30
Sell
Lowest
9
- Market has been dominated by sharply higher
volatility and violent factor rotation over the
past six months.
Accessor Growth fund 105 stocks
CEP inception w/Accessor fund 70 stocks
10
Active Risk
- If an investment manager is being compared to a
performance benchmark, then the difference in
return between his portfolio return and the
benchmarks return is of crucial importance, the
difference is active return. - The Active Risk is defined as the standard
deviation of the active return. Active Risk is
also known as Tracking Error, since it
describes how well the portfolio can track the
benchmark.
11
Portfolio Construction/Risk Control
- Goal Make sure we get consistent returns for
the risk we take - Understand Benchmark Characteristics
- Set Tracking Error Constraint
- Target Excess Return
- Build Portfolios
12
Portfolio Construction
Eliminate
Neutralize
Capitalization Variance
Emphasize
Stock Selection
13
Sector Weightings
As of 5/31/01
14
Accessor Growth Fund
as of 05/31/01
15
Example-American Home Products (AHP)
16
Why Not Sector/Size/Style Bets?
- Over a long time frame a diversified portfolio
substantially outperforms the various sector
components on a risk-adjusted basis. - The long-term winning sectors in terms of return
are nearly impossible to identify--even after the
fact! - On a short-term basis, there is substantial
evidence against the efficacy of market timing --
whether this is measured in size and style terms,
or in sector terms.
17
Source Ibbotson Associates
18
Source PSN
19
Source PSN
20
Large Cap Core Universe (1995-99)
Excess Annualized Return
vs.
Annualized Tracking Error
Percentage Outperforming lt 3 Tracking Error
57 gt 3 Tracking Error 31
10
Average -2.0
5
0
Annualized Excess Return ()
-5
-10
-15
0
1
2
3
4
5
6
7
8
9
10
Source PSN
Annualized Tracking Error ()
21
Why a Risk-Controlled Approach?
- Empirical evidence supports the contention that
active management can consistently add value over
3-5 years, if it is pursued in a risk-controlled
fashion. - Broad evidence of negative value-added stems from
analysis of broad segments, rather than focusing
on specific sub-segments of investment approach
or tracking error. - Most managers detract value because of the
excessive impact of market timing elements that
are negative on average, overwhelming the impact
of positive average security selection. - Higher tracking error approaches can beat the
benchmark by a larger amount, but have a higher
probability of underperforming and by a greater
amount. This is because efficiency is lost as
tracking error increases. The trade-off between
return and tracking error is not uniform, largely
due to the constraint of a long-only portfolio.
22
- Value-based rally began as typical earnings-based
factors drove a sector-oriented rally - This was followed by a focus on P/E, Downward
Revisions and Earnings Dispersion across sectors - This has been followed by an emphasis on
non-earnings value metrics like Dividend Yield
and P/B
23
Our Factor Approach
- Our model represents a balance of estimate
momentum, quality and value factors. This
weighting is determined based upon the long-term
average preferences of the market. - In the growth universe, the value metrics keep us
out of the tails and drive us toward the center
of the distribution. However, the primary
drivers of the growth stocks over the past decade
have been earnings growth related factors. - Value factors as primary drivers of relative
growth stock performance, which we have seen over
the past six months, are anomalous and signal
broader market and economic uncertainty, which is
likely to be temporary.
24
Our Factor Approach
- Our models factor weights will adjust
dynamically if there is a persistent trend
movement in the markets preferences for
particular factors in the way that it values
securities. This moderated approach prevents
getting burned by factor shifts and subsequent
reversals. - If sharp factor rotation continues we dont want
to chase the market by shifting weightings to
factors that the market has most recently
favored.
25
- Historical market averages are above long-term
average P/E of 14 (measured from 1926-present) - Current SP 500 trading at both trailing and
forward P/E of 21 - Before bubble burst, SP Tech sector trading at
twice P/E multiple of any other growth sector,
like Healthcare or Consumer Staples - Today, Tech sector trades at a similar multiple,
of around 30, with other growth sectors - Value sectors trading in high teens to low-mid 20
multiples, which are high relative to historical
standards - All sectors high relative to historical ranges,
though we dont see any disconnect between
sectors that we saw previously.
26
- Market is probably telling us that this is a
cyclical downturn - Above -average earnings growth path should return
to an above average earnings growth path with the
catalyst being an underlying improvement in
economic structural productivity
27
- Model incorporates upward and downward revisions
in analyst estimates for earnings in the current
and next fiscal years. - Model also incorporates the magnitude of the
change in estimates over the last one and three
months. - We dont use long-term growth rates, which are
always highly inflated, our research shows this
factor has no reliable bearing on stock price
movements. - We dont use price targets and we dont forecast
multiples. - We compare one stock versus another, given
current multiples and the analyst consensus
earnings expectations. - We use information that is relevant in
forecasting near and intermediate-term stock
moves-are the earnings expectations moving up or
down and by how much.
28
SP/BARRA Growth - SP/BARRA Value Performance
History
Growth Outperformed Value
Value Outperformed Growth
Source Ibbotson Associates
29
Footnotes
Information on Accessor Funds, Inc. may not be
distributed to the public unless it is preceded
or accompanied by the prospectuses of Accessor
Funds, Inc. which describe in detail the
investment policies, management fees, and other
matters of interest to the prospective investor.
Through separate prospectuses, the Fund offers
two classes of shares, the Investor Class Shares
and the Advisor Class Shares, shown here. Each
class has different expenses that would affect
performance. Alloset is proprietary asset
allocation software of Accessor Capital
Management LP. Please contact Accessor Funds at
800-759-3504 for a free copy of the current
prospectus. PLEASE READ THE PROSPECTUSES
CAREFULLY BEFORE YOU INVEST OR SEND MONEY. The
performance data quoted represents past
performance of the Advisor Class shares and is
not indicative of future results. The investment
return and principal value of an investment will
fluctuate so that an investors shares, when
redeemed, may be worth more or less than their
original cost. The benchmark comparative
indices represent unmanaged returns on various
financial assets and does not reflect fees or
expenses. You cannot invest in an index. Past
performance is not a predictor of future results.
Except as otherwise indicated, the information
set forth herein has been extracted from various
public and private sources. Accessor makes no
representations as to the accuracy of the
information, nor has Accessor attempted
independently to verify it. All trademarks are
the property of their respective organizations.
The prospectuses of Accessor Funds, Inc.
describe in detail the Funds investment
policies, all fees and expenses and other matters
of interest to the prospective investor. Alloset
is the proprietary asset allocation software of
Accessor Capital Management LP. Alloset and
Accessor are registered trademarks of Accessor
Capital Management. 1. a. Effective March 16,
2000, Chicago Equity Partners Corp. manages the
Growth Fund (formerly managed by State Street
Bank and Trust Company from inception to July 20,
1997 and Geewax Terker and Company from July 21,
1997 to March 15, 2000). 2. The SP 500 Index is
an unmanaged index of 500 common stocks chosen to
reflect the industries in the U.S. economy. The
SP 500/BARRA Growth Index is an unmanaged index
of growth stocks in the SP 500 Index. Large
capitalization growth stocks are the stocks
within the SP 500 that generally have high
expected earnings growth and higher than average
price-to-book ratios. The SP 500/BARRA Value
Index is an unmanaged index of value stocks in
the SP 500. Large capitalization value stocks
are the stocks within the SP 500 that generally
are priced below the market average based on
earnings and lower than average price-to-book
ratios. The indices represent unmanaged returns
on various financial assets. Investments cannot
be made directly in an index. Past performance is
not a predictor of future results. Except as
otherwise indicated, the information set forth
herein has been extracted from various public and
private sources. Accessor makes no
representations as to the accuracy of the
information, nor has Accessor attempted to
independently verify it. All trademarks are the
property if their respective organizations.
Recommended
CrystalGraphics Presentations


