
Dialogue on Water and Climate in Greater Nagoya Area - PowerPoint PPT Presentation
1 / 48
Title:
Dialogue on Water and Climate in Greater Nagoya Area
Description:
Dialogue on Water and Climate in 'Greater Nagoya Area' Flood in Shonai River Basin, ... Region and Greater Nagoya Area. Review of past hydrological phenomena, flood ... – PowerPoint PPT presentation
Number of Views:54
Avg rating:3.0/5.0
Title: Dialogue on Water and Climate in Greater Nagoya Area
1
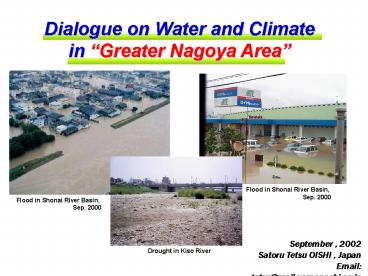
Dialogue on Water and Climate in Greater Nagoya
Area
Flood in Shonai River Basin, Sep. 2000
Flood in Shonai River Basin, Sep. 2000
September , 2002 Satoru Tetsu OISHI ,
Japan Email tetsu_at_mail.yamanashi.ac.jp
Drought in Kiso River
2
Greater Nagoya Area
Objectives Points of discussion
- Identifying phenomena of climate change
- and climate variability in Global, East Asia
- Region and Greater Nagoya Area
- Review of past hydrological phenomena, flood
- disaster and drought in GNA
- Encourage wider participations through
- VWF, WV and Forums
- Dialogue between experts and residents
Wrap up the Synthesized Paper
3
Greater Nagoya Area
Dialogue Area
- Greater Nagoya Area
- record heavy rain and devastating flood
- (Sep. 2000)
- - frequent drought
East Asia - Monsoon Climate
Maximum value of daily rainfall in record (Sep.
2000, Nagoya)
4
Greater Nagoya Area
Structure of the Dialogue
Sub-committee on Climate
Committee
Residents in River Basin
Dialogue
Sub-committee on River Response
Dialogue in Open Pre-Forum (Dec. 4, 2002)
Secretariat
Wide Dialogue through VWF and WV
Other groups
5
Greater Nagoya Area
Present Status - Phenomena
- Over the 20th century, the global average surface
temperature1 has increased 0.60.2?. - Globally, it is very likely that the 1990s was
the warmest decade and 1998 the warmest year in
the instrumental record, since 1861.
Variations of the Earths surface temperature for
the past 140 years
Global
Departures in temperature (?) from the 1961 to
1990 average
Legend Red bars Year by year Black 10 year
average (Data from thermometers)
Year
1 The average of near surface air temperature
over land, and sea surface temperature
Source IPCC, Climate Change 2001 (The Scientific
Basis)
6
Greater Nagoya Area
Present Status - Phenomena
- As for Japan, annual precipitation - average year
ratio in 51 points shows decreasing trend of
about 6 per 100-year (The change width of
several years scale got bigger in after 1970. Not
only radical rainless year like 1978, 1984 and
1994 increased, but also radical pluvious year
like 1980,1993 and 1998 increased). - But, the trend of the increase or decrease varies
according to the locality.
Annual precipitation - average year ratio in
Japan
130
120
110
Annual precipitation - average year ratio ()
100
90
Average year 1971-2000 Brown line five-year
movement average
80
70
1890
1900
1910
1920
1930
1940
1950
1960
1970
1980
1990
2000
2010
Year
Source The Meteorological Agency "climate change
watch report 2001"
7
Greater Nagoya Area
Present Status - Phenomena
- And, it was observed the phenomena the
precipitation was suddenly changed (decreasing
trend, heavy rain occurring frequently)
regionally, too.
Variation of annual precipitation in Maebashi
1800
1800
1600
1600
1400
1400
Annual precipitation (mm)
????(mm)
????(mm)
1200
1200
1,125mm
1,036mm
1000
1000
800
800
Decade-semiarid precipitation (-1959)
600
600
1890
1900
1910
1920
1930
1940
1950
1960
1970
1980
1990
2000
1890
1900
1910
1920
1930
1940
1950
1960
1970
1980
1990
2000
Year
? Occurred Water shortage
Source YONETANI
8
Greater Nagoya Area
Present Status - Phenomena
Variation of the maximum daily rainfall in
Asahikawa
1981
81 years.
1975
Rain probability 150 years
75 years
Annual maximum daily rainfall (mm)
River improvement
1900
1950
1974
Year
Source.YONETANI
9
Greater Nagoya Area
Present Status - Direct consequences
Various records of Tokai torrential rain (Sep.11,
2000)
Flood conditions (Shonai River Basin)
10
Greater Nagoya Area
Present Status - Direct consequences
General weather situation of Tokai torrential
rain (Sep.11, 2000)
Autumnal rain front was delayed in the Japan sea
coast. Warm and wet air flew into this front
from east side of typhoon No.14 above the pacific
ocean of southern Japan ,and the atmosphere above
Japan was in precarious condition. The typhoon
was moving slowly towards north, causing the warm
and wet air,flowing into the front to become
stronger, and the strong rain zone to move
slowly. Strong rain cloud delayed during several
hours in one location without becoming weak, and
as a result, torrential rain occurred.
Interactive weather map (Sep.11, 2000 600)
Sep.11, 2000 600
H
H
L
Almost delayed
H
Slowly
H
L
Nagoya
H
Autumnal rain front
Slowly
Slowly
Typhoon No.14
T-14
T-15
L
Almost delayed
11
Greater Nagoya Area
Present Status - Direct consequences
Various records of Tokai torrential rain (Sep.11,
2000)
Sept. 11
Sept. 12
428mm/day -Record (2nd most is 240mm/day
in 1890)
Flooded Area (Nagoya-City)
12
(No Transcript)
13
(No Transcript)
14
(No Transcript)
15
(No Transcript)
16
Greater Nagoya Area
Present Status - Indirect effects
KISOGAWA BASIN
Misogawa Dam
Makio Dam
Iwaya Dam
Tokuyama Dam
Agigawa Dam
?Gifu
?Tokyo
?Nagoya
Osaka?
?Nagoya
Nagaragawa Estuary weir
Dam (Existing)
Dam (Under Construction)
Weir (Existing)
17
Greater Nagoya Area
Present Status - Indirect effects
Water resource planning (drought) in Japan
- Water development was planned to supply water
from a dam during a drought year of once every 10
years - Water resources planning was based on various
data from 1940s to 1960s - However, as a result of the simulation based on
recent data of drought years, required water
cannot be supplied from the dam.
18
Greater Nagoya Area
Present Status - Indirect effects
Ideal situation of dam operation in a drought
year (Simulation result)
(Example) Iwaya Dam (In 1987 drought year
occurring once every 10 years)
(million m3)
60
Deficiency days80 Days
Dam pondage
50
40
30
20
10
0
Planned amount of water supply
(m3/sec)
40
deficiency amount
30
Total deficiency amount 160 million m3
20
10
0
0
05/87
06/87
07/87
08/87
09/87
10/87
11/87
12/87
01/88
02/88
03/88
04/87
?Precondition ? As planned, each facility is
supposed to keep supplying the necessary volume
of water (saving water such as intake water
limitation in actual management isn't done).
The total amount of water that cannot be
supplied by a dam is called "the total deficiency
amount". The days when water can't be supplied
are called "the deficiency days". Agriculture
water is not taken into consideration because the
amount of this water changes according to seasons
Ministry of Land, Infrastructure and Transport,
formerly National Land Agency and Ministry of
Construction
19
Greater Nagoya Area
Present Status - Indirect effects
Condition of Iwaya dam in 1994 drought
Iwaya dam (15th Aug 1994, Water storage rate 0.0
)
1994 Drought Report, Water Resources Development
Public Corporation
20
Greater Nagoya Area
Present Status - Indirect effects
The amount of deficiency toward the total amount
of planned supply (Simulation result)
?Note? This table shows planned amount of city
water supply and total deficiency amount.
Total planned amount of water supply use of
water volume (m3/sec) X 24-hour/day X 60-minute X
365-day Total deficiency amount of water
Unavailable amount of water in conditions of
inexistent water utilization storage in
dams and deficient natural inflow. There is a
case where the value of the total sum doesnt
correspond with the non rounded off total.
21
Greater Nagoya Area
Session room in Virtual Water Forum
Climate change influence on flood and drought in
East Asia Effects and Response
- Chairperson Prof. Toshiharu KOJIRI (Kyoto
Univ.)
- Contact person Kenzo FURUTANI (Chubu Regional
Bureau, MLIT)
22
Greater Nagoya Area
Mid-term summary in Virtual Water Forum
Kisogawa Basin, where water use is well
developed Shonaigawa River and Shinkawa River,
where flood damage was big in recent years
23
Greater Nagoya Area
Pre-Forum
Dates December 4 ,2002
Venues Nagaragawa Convention Center
( Gifu,JAPAN )
24
Greater Nagoya Area
The 3rd World Water Forum
Dates March 16-23,2003
Venues Kyoto,Shiga,Osaka in Japan
Presentation of the Synthesis Report
25
Future
Climate Change
River Management Control
New Result of Research
- Researching
- Operations Research Method
- Pattern Recognition method
- Neural network method
- FAZZY method
- Researching
- Earth Simulator
- 1km grid global atmospheric and hydrological model
26
Artists Birds-eye View of the Earth Simulator
Cartridge Tape Library
Disks
Processor Node (PN) Cabinets (320)
Interconnection Network (IN) Cabinets (65)
Air Conditioning System
65m
Image of 1km grid model
Power Supply System
50m
Double Floor for Cables
27
Global 1km resolution model
28
Precipitation (Resolution 10km)
Cyclone near Madagascar, (Leftprecipitation,Right
temperature)
29
New Result of Research
Pattern recognition of Large Scale Weather
Long term forecast of precipitation
Variation of the shape of hydrograph
Optimum control under drought situation
Variation of the damage of drought
30
Pattern Recognition of the Large Scale Weather
31
New Result of Research
Pattern recognition of Large Scale Weather
Long term forecast of precipitation
Variation of the shape of hydrograph
Optimum control under drought situation
Variation of the damage of drought
32
Long Term Forecast of Precipitation
33
Greater Nagoya Area
Structure of the Dialogue
Sub-committee on Climate
Committee
Residents in River Basin
Dialogue
Sub-committee on River Response
Dialogue in Open Pre-Forum (Dec. 4, 2002)
Secretariat
Wide Dialogue through VWF and WV
Other groups
34
Thank you. We are looking forward to seeing you
in WWF.
???????????. WWF?????????.
35
Greater Nagoya Area
Committee Sub-committee
36
Greater Nagoya Area
Committee Sub-committee
37
Greater Nagoya Area
Present Status - Phenomenon
- New analyses of proxy data for the Northern
Hemisphere indicate that the increase in
temperature in the 20th century is likely to have
been the largest of any century during the past
1,000 years.
Variations of the Earths surface temperature for
the past 1,000 years
Northern Hemisphere
Departures in temperature (?) from the 1961 to
1990 average
Legend Red Year by year (from thermometers)
Blue Year by year (Data from tree rings,
corals, ice cores and historical
records) Black 50 year average Grey The 95
confidence range in annual data
?????????????? ?50???? ?????????95?????
Year
Source IPCC, Climate Change 2001 (The Scientific
Basis)
38
Greater Nagoya Area
Present Status - Phenomenon
The trend distribution of annual
precipitation-average year ratio in Japan
Rainy days
Annual precipitation
14-day
200mm
7-14 days
100200mm
0100mm
0 7 days
Period 1961-2000 Orange means decrease, green
means increase The unit of the trend around
40-year
Source Collected papers in autumn meeting
of Meteorological Society of Japan
(ISOBE, 2001)
39
Greater Nagoya Area
Present Status - Phenomenon
- A change appears on the climatic sides as well
which it should pay attention to. - Annual continental precipitation in the world
increased about 2 during the 20th century. - The trend of the increase or decrease varies
according to periods and localities.
Annual precipitation - average year ratio on the
earth
120
Global
110
100
Annual precipitation - average year ratio ()
90
Average year 1970-2000
80
1880
1900
1920
1940
1960
1980
2000
Year
?
Source Japan Meteorological Agency
Climate Change Monitoring Report 2001
40
Greater Nagoya Area
Present Status - Phenomenon
- Though it doesn't show increasing tendencies, it
is much condition several years recently about
the number of occurrences of the heavy rain more
than 50mm/ hour observed by Automated
Meteorological Data Acquisition System (AMeDAS)
in the whole country since 1979 in the whole for
23 years and for a short period of time.
The number of occurrences of a heavy rain (based
on AMeDAS data in Japan)
It is based on AMeDAS data of 1979-2001 in 1,300
points in Japan. In more than 50mm hour, the
number of total occurrences of the precipitation
of 100mm and more. As for 100mm/ hour and more
number of occurrences, numerical value was put.
Legend Green More than 50mm/ hour Red More than
100mm/ hour
Source Just recent investigation by Japan
Meteorological Agency
41
Greater Nagoya Area
Present Status - Phenomenon
42
Greater Nagoya Area
Present Status - Phenomenon
- As for the frequency of a heavy rain after 1961
and the strength trend as well. Increasing and
decreasing trends vary in each area.
The trend distribution of a heavy rain in Japan
Heavy rain intensity
Heavy rain frequency
Legend Orange decreasing Green increasing
Legend Orange decreasing Green increasing
2 days
20mm
12 days
1020mm
01 day
010mm
Unit of trend 40 years (1961-2000)
Heavy rain intensity averaged to the upper the
4th of each daily rainfall in the annual
precipitation Heavy rain frequency averaged to
the upper the 4th each daily rainfall from 1961
to 1990
Source Collected papers in autumn meeting of
Meteorological Society of Japan (ISOBE, 2001)
43
Greater Nagoya Area
Present Status - Direct consequences
The course of typhoon No. 6 (July,2002)
44
Greater Nagoya Area
Present Status - Direct consequences
Precipitation distribution map due to typhoon
No. 6
200
100
Precipitation Total precipitation observed in
each weather observation office Weather
observation office Ministry of Land,
Infrastructure and Transport Beginning of
precipitation from July 9th, 2002 at 1200
Tokuyama weather observation office (Ibi River
Basin) End of precipitation to July 11th, 2002
at 200 Ichinose weather observation office
(Kano River Basin)
?Neo
400
500
Shiga pref.
Ibi RIver
Gifu pref.
Otani River
200
Nagara River
300
Nagano pref.
Makita RIver
?Mangoku
100
Karasue?
Kiso River
300
200
200
Shonai River
300
Yamanashi pref.
400
Aichi pref.
400
200
Ise Bay
300
200
Mie pref.
Shizuoka pref.
Nara pref.
100
200
Enshu Sea
100
Suruga Bay
200
100
300
200
Kumano Sea
200
100
45
Greater Nagoya Area
Present Status - Direct consequences
Flood condition due to typhoon No. 6 in the Ibi
River(July,2002)
46
Greater Nagoya Area
Present Status - Direct consequences
Water Level Graph (Ibigawa)
Water levelMangoku Point (Ibigawa) Weather
Observation OfficeNeo
Zero elevation TP5.00
?Total precipitation? 562mm
Hourly Precipitation (m)
?Water level peak? 2002.7.10 (1230) 7.38m
?Hourly precipitation peak? 111mm
Water Level (m)
July 2002 Flood
Warning Water Level (4.00m)
Time
47
Greater Nagoya Area
Point of discussion in Virtual Water Forum
- Phenomenon
- Direct consequences
- Indirect effects - feared bad effects
- Response
48
Greater Nagoya Area
Pre-Forum Program (plan)
Opening
Purpose of the Pre-Forum
Climate Session Speakers Japan
Meteorological Agency Isobe, Forcast Officer
Chinas Climate Center Prof.Ding
Division of Atmospheric Reseach?Harold
Gordon
River Response Session Speakers
Rainfall Yamanashi Univ. Satoru Oishi,
Assoc.Prof. Basin Gifu Univ.
Seirou Shinoda, Assoc.Prof.
Dr. Yongqin
David Chen
(ChinaHong Kong) Statistics Control
Dr. P.P. Mujumdar (India)
Review
Panel Discussion
Closing
Recommended
CrystalGraphics Presentations


