
Introduction to Visual Image Interpretation, Chapter 4, Remote Sensing and Image Interpretation - PowerPoint PPT Presentation
1 / 51
Title:
Introduction to Visual Image Interpretation, Chapter 4, Remote Sensing and Image Interpretation
Description:
E.g., urban use, residential use, or single-family housing. ... This removes red and similarly blue from white light, giving green color of leaves. ... – PowerPoint PPT presentation
Number of Views:8017
Avg rating:3.0/5.0
Title: Introduction to Visual Image Interpretation, Chapter 4, Remote Sensing and Image Interpretation
1
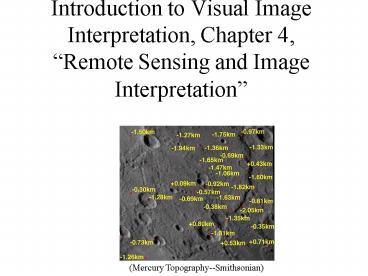
Introduction to Visual Image Interpretation,
Chapter 4, Remote Sensing and Image
Interpretation
(Mercury Topography--Smithsonian)
2
Table of Contents
- Land Use
- Geologic Mapping
- Sedimentary Rocks
- Fractures and Faults
- Landform Identification and Evaluation
- Vegetation Indices
- Agriculture Applications
- Forestry Applications
- Range-land Applications
- Fluvial Erosion Deposition
- Water Resource Applications
- Environmental Assessment
- Flood Damage Estimation
3
Land Use/Land Cover Mapping
- Knowledge of land use and land cover important
for planning and management activities. - Land cover maps being developed from local to
national to global scales. - Panchromatic, medium-scale aerial photographs to
map land use has been the acceptable way since
1940s. - More recently, small-scale aerial photographs and
satellite images have been used for land use/land
cover mapping. - Land cover terminology relates to the type of
feature present on Earths surface. - Corn fields, lakes, maple trees, etc
- Land use relates to human activity.
- E.g., urban use, residential use, or
single-family housing. - Knowledge of both land use and land cover can be
important. - USGS devised land use and land cover
classification system for use with remote sensor
data in mid-1970s.
4
USGS Land Use / Land Cover Example
- Classification System listed on page 210 (Level 1
and Level 2). - 21 - Cropland and pasture
- 43 - Mixed forest land
- 61 - forested wetlands
(USGS)
5
High-Resolution Land Use and Land Cover mapping
- Left side - 1996
- Right side 2050 (predicted).
Albuquerque, NM
6
Geologic and Soil Mapping
- Earth has a highly complex and variable surface.
- Topographic relief and material composition
follow the geology underlie each part of the
surface. - Type of rock, fractures, erosion, depositional
features, etc, bear imprint of processes that
produced them. - Persons seeking to understand and explain Earth
materials must be able to recognize surface
expressions of various materials and structures. - Visual image interpretation and geologic and soil
mapping allow materials and structures to be
identified and evaluated. - Geologic and soil mapping will always require a
considerable amount of surface field exploration. - However, mapping process can be greatly
facilitated through the use of image
interpretation.
7
Geologic Mapping
- First aerial photographs for geologic mapping
purposes taken in 1913 (Bengasi, Libya). - Earliest uses of air photos were for geologic
data base map compilation -- especially for
petroleum exploration. - Some interpretive uses of aerial photographs date
back to the 1920s. - Widespread use of air photos for geologic mapping
and evaluation began in the 1940s. - Geologic mapping involves the identification of
landforms, rock types, and rock structures
(folds, faults, and fractures). - Much information about potential areas for
mineral exploration can be provided by
interpretation of surface features on aerial
photographs and satellite images.
8
Geologic Applications
- Remote sensing useful for
- Mapping rock units (stratigraphy).
- Studying the expression and modes of the origins
of landforms (geomorphology). - Determining the structural arrangements of
disturbed strata, such as folds and faults
(structural geology). - Evaluating dynamic changes from natural events,
e.g., floods, volcanic eruptions, earthquakes
(hazards). - Seeking surface clues, such as alteration and
other signs of mineralization, to subsurface
deposits of ore minerals, oil and gas, and
groundwater.
9
Sedimentary Rocks
- There are three general types of rock
- Sedimentary rocks most common and extend over 75
of lands surface. - Igneous rocks extend over 20 of lands surface.
- Metamorphic rocks extend over about 5.
- Sandstone, shale, and limestone are principal
sedimentary rocks that are considered. - Sedimentary rocks formed by consolidation of
layers of sediments that have settled out of
water or air. - Clastic sediments are converted into coherent
rock masses by lithification, a process which
involves cementation and compaction by weight of
overlying sediments. - Nature of constituent particles and way in which
they are bonded determine texture, permeability,
and strength strength of the rocks.
10
Sedimentary Rocks (Continued)
- Sedimentary rocks containing primarily sand-sized
particles are called sandstone. - Those containing primarily silt-sized particles
are called siltstone. - Those containing primarily clay-sized particles
are called shale. - Limestone has high calcium carbonate content and
is formed from chemical or biochemical action. - Chemical precipitation of mostly calcium
carbonate (CaCO3) from water. - Biochemical processes acting on shells, shell
fragments, and plant materials. - Clastic deposition of shell material as marine or
lacustrine environment. - Principal sedimentary rock characteristics that
affect appearance on aerial and space images are
bedding, jointing, and resistance to erosion,
i.e., resistant cliff forming strata.
11
Sedimentary Rocks (Continued)
- Sedimentary rocks are mostly stratified or
layered. - Individual layers called beds.
- Top and bottom of each bed have more or less
distinct surfaces called bedding planes that
terminate one bed and begin another, i.e.,
unconformities. - Individual beds have somewhat different
characteristics. - Thickness varies from few millimeters to hundreds
of meters - Usually start off nearly horizontal but may tilt
due to movements of earths crust, i.e., tectonic
activity. - Joints are cracks through solid bodies of rocks
that that have little or no movement parallel to
joint surfaces. - Primarily perpendicular to bedding planes
- May intersect other joint planes
- Several systematic joints constitute joint set,
and two or more sets in a recognized area form a
joint system - Streams often follow joint lines, moving from one
to another.
12
Sedimentary Rocks (Continued)
- Resistance to erosion depends on rock strength,
permeability, and solubility. - Rock strength a function of bonding agent
- Thick beds of sandstone bonded by quartz
(ortho-quartzite) are very strong and may be used
as building material. - Thin beds of shale are very weak.
- Permeability refers to ability of rock to
transmit water and depends on pore spaces between
sediment particles. - Sandstone generally very permeable can be an
aquifer. - Shale is usually very impermeable, can be an
aquaclude. - Limestones are soluble in water over thousands of
years, especially if carbonic acid present, e.g.,
karst topography.
13
Sedimentary Rocks (Continued)
- Sandstone
- Bedding often prominent on images, especially
when occurring over softer, more easily eroded
formations such as shale. - Jointing is prominent, with joint system
consisting of two or three dominant directions. - Resistance to erosion varies depending on
strength of cementing agent. - Cemented with iron compounds and silica typically
strong, e.g., ironstone concretions. - Cemented with carbonates weaker.
- Very permeable, with rainfall percolating
downward through rock rather than becoming
erosion-producing surface runoff. - Percolating water can dissolve carbonate
cementing agent.
14
Fractures and Faults
- A fracture (or joint) is a crack or break in the
rock in which either side springs apart by a
small distance. - Seen from a distance as linear mark in which tone
is same on each side. - A fault is a break in which the rock on one side
slides or slips against the rock on the other
side so that each is displaced by some distance. - Sharp discontinuity in tonal pattern is a
distinct possibility.
(rst)
15
Morro Bay Imagery
(rst)
h-Morro Rock
16
Histogram from Morro Bay Imagery
- Big return at 12 due to ocean
- Returns around 28 from land
(Remote Sensing Tutorial)
17
Finding Oil
- Case study by Eason Oil and Earth Satellite Corps
- Landsat imagery examined in areas that have
established petroleum reserves. - Telltale surface indications
- Standard-processed and computer-enhanced data.
- Areas selected in which the surface does not give
clear indication of subsurface conditions. - If imagery identified hydrocarbons under
difficult conditions, Landsat would increase in
stature as an oil/gas discriminator. - Andarko Basin of south-central Oklahoma selected.
- Basin, or down-sag, in crust allowed sedimentary
rock to accumulate. - Oil and gas present in structural and
stratigraphic traps.
18
Finding Oil Continued
(rst)
- Surface expressions in basin meager.
- Investigators focused on undiscovered fractures
and subtle chemical alterations. - Results inconclusive and discouraging.
19
Elements of Image Interpretation for Landform
Identification and Evaluation
- Systematic observation and evaluation of key
elements studied stereoscopically - Topography
- Drainage pattern and texture
- Erosion
- Image Tone
- Vegetation
- Land use
20
Topography
- Each landform and bedrock type has own
topographic form - Typical size and shape
- Change at boundary between two different
landforms - Vertical photographs with normal 60 overlap
appear exaggerated in height by three to four
times for most individuals. - Slopes appear steeper than they are
- Specific amount of vertical exaggeration observed
in stereopair is a function of geometric
conditions under which photographs are viewed and
taken.
21
Stereo to Topography Methodology from Smithsonian
(Lunar Crater Topography)
22
Vegetation and Land Use
- Differences in natural or cultivated vegetation
often indicate differences in terrain conditions,
some examples - Orchards and vineyards normally located on
well-drained soils. - Truck farming takes place on highly organic soil
with perhaps large peat deposits. - In other cases, vegetation and land use can
obscure differences in terrain conditions.
23
Soil Mapping
- Employed heavily in comprehensive land use
planning. - Must be premised on thorough inventory of natural
resource base. - Detailed soil surveys are the product of
intensive study of soil resources by trained
scientists. - Air photo interpretation has been heavily coupled
with extensive field work. - Soil scientists traverse landscape on foot,
identify soils, and delineate soil
boundaries. - Relationships of soils to vegetation, geologic
parent material, landform, and landscape
position are evaluated. - Air photo interpretation has been used since
early 1930s to facilitate the soil mapping
process. - USDA has been preparing soil survey maps since
about 1900. - Most soil surveys since 1957 have contained soil
maps on photomosaic base at a scale of 124000,
120000, or 115840.
24
Agriculture Applications and Crop Management
Information
- Pre-planting variations studied in surface
moisture, texture, and organic content. - Plowing / Planting progress determined,
drainage, runoff, and erosion. - Emergence time delayed emergence detected, such
as low plant density, insect, disease, or weather
problems. - Mid-growing season observed damage due to
adverse moisture, misapplication of chemicals,
insects, diseases, eroded top soil. - Pre-harvest stand condition checked, acreage to
be harvested, significant weed invasion. - Post-harvest area determined to be harvested,
weed and volunteer re-growth, erosion, and soil
moisture problems.
25
Vegetation Indices
- Spectral bands can be combined to accentuate
vegetated areas. - Ratio Vegetation Index (RVI) is ratio of sensed
radiation bands. - RVI NIR / Red
- Vegetation has high NIR (Near Infrared) return
and low red return.
(Virtual Science Centre)
26
Normalized Difference Vegetation Index (NDVI)
- NDVI (NIR - Red) / (NIR Red)
- NDVI band combined with other bands to form color
composite.
( Virtual Science Centre)
27
Vegetation Applications
- Many sensors operate in green, red, and near IR
(NIR) regions. - Vegetation radiation absorption and reflectance
discriminated. - Absorption centered at 0.65 ?m (visible red) by
chlorophyll pigment. - This removes red and similarly blue from white
light, giving green color of leaves. - Strong reflectance between 0.7 and 1.0 ?m, NIR
band. - Tonal signatures on multispectral images
distinct. - Darker tones in blue
- Darker tones especially in red
- Somewhat lighter in green
- Notably lighter in near IR.
28
Vegetation Applications Continued
(rst)
29
Landsat Vegetation Application
(rst)
30
Principles of Landform Identification and
Evaluation
- Various terrain characteristics important to soil
scientists, geologists, geographers, civil
engineers, urban and regional planners, landscape
architects, real estate developers, and others. - Numerous terrain characteristics can be estimated
by means of visual image interpretation, such as
- Bedrock type
- Landform
- Soil texture
- Site drainage conditions
- Susceptibility to flooding
- Depth of unconsolidated materials over bedrock
31
Forestry Applications
- Growing challenges exist with management of
forests for wood, forage, water, wildlife, and
recreation. - Special concerns with timber management,
maintenance, and improvement of existing stands. - These cover nearly one-third of worlds land
area. - distributed unevenly with widely varying value.
- Visual image interpretation used to monitor many
of worlds forest conditions. - Trees identified on aerial and satellite images
through process of elimination. - Species eliminated which are impossible or
improbable because of location, physiography, or
climate. - Groups of species identified in area.
- Identify individual tree species using basic
image interpretation principles, such as - Shape, size, pattern, shadow, tone, texture.
32
Vegetation and Deforestation
- AVHRR Index
- Europe probably most vegetated.
- South America next in vegetation.
- Australia least vegetated.
33
Vegetation and Deforestation
- Farmlands/open area in black.
- 200,000 out of 1.9 million square miles cleared.
- Public outcry slowing removal.
- Brazilian Amazon Deforestation
- Rain forests in blue/purple.
- Woodlands in green/yellow.
34
Range-land Applications
- Range-land defined as predominantly grasses,
grass-like plants, or shrubs. - Animal grazing important influence in
pre-civilization state - Potential land use as agriculture, recreation, or
housing - Range-land management utilizes science and
experience for protection, improvement, and
continued welfare of basic range-land resources. - Soils
- Vegetation
- Endangered plants and animals
- Wilderness, water, and historical sites
- Emphasis placed on the following (table 4.14,
page 247). - Suitability of vegetation for multiple uses
- Design and implementation of vegetation
improvements - Implications of social and economic effects of
alternate land use - Control of range pests and undesirable vegetation
- Reclamation of soil and vegetation on disturbed
areas.
35
Drainage Pattern and Texture
- Six common drainage patterns are illustrated in
figure 4.36, page 287 - Dendritic formed by main stream with tributaries
branching and rebranching
freely. - Rectangular dendritic pattern modified by
structural bedrock such
that tributaries meet at right angles. Typical of
massive sandstone formations with well-developed
joint system. - Trellis drainage pattern consists of streams
having one dominant direction, with subsidiaries
at right angles. Occurs in areas of folded
sedimentary rocks. - Radial drainage pattern is formed by streams
that radiate outward from a central area. Typical
of volcanoes and domes. - Centripetal reverse of radial drainage pattern
in that drainage is directed a central point.
Occurs in areas of limestone sinkholes, glacial
kettle holes, volcanic craters, and other
depressions. - Deranged disordered pattern of of aimlessly
directed short streams, ponds, and wetland areas
of ablation glacial till areas.
36
Erosion
- Gullies are small drainage features that can be
as small as a meter wide and a hundred meters
long. - Result from erosion of unconsolidated material
from runoff - Develop where rainfall cannot adequately
percolate into ground but collects and flows
across the surface in small rivulets - Enlarge and take on shape characteristic of the
material in which they are formed - Short gullies with V-shaped cross sections tend
to develop in sand and gravel (figs 4.38 and
4.39, pages 288 and 289). - Gullies with U-shaped cross sections tend to
develop in silty soils (figs 4.38 and 4.39). - Long gullies with gently rounded cross sections
tend to develop in silty clay and clay soils
(figs 4.38 and 4.39).
37
Water Resource Applications
- Water is one of our most critical resources uses
are - Irrigation
- Power generation
- Drinking
- Manufacturing
- Recreation
- Most sunlight absorbed within two meters of
waters surface. - Absorption highly dependent on wavelength.
- Near IR absorbed in few tenths of a meter of
water, resulting in very dark tones. - Absorption in visible portion dependent on
characteristics of water body. - Best wavelengths for clear, calm water
penetration between 0.48 and 0.60 ?m (up to 20 m
penetration). - Sand bottoms appear blue-green using normal color
film - Color IR film clearer because blue filtered out
and essentially no near IR (two-layer film).
38
USGS Water Use Program
- Analyze source, use, and disposition of water
resources - Reply to water-use information requests
- Document trends in water-use
- Cooperate with agencies on special projects
- Develop water-use data bases
- Publish water-use reports
39
Water Pollution Detection
- All natural water has some impurities.
- Considered polluted when presence of impurities
sufficient to limit its domestic and/or
industrial use. - Not all pollutants the result of human activity.
- Minerals leached from soil
- Decaying vegetation
- Appropriate to consider two types of pollution
sources. - Point Highly localized, such as industrial
out-falls - Non-point Fertilizer and sediment run-off
40
Water Pollution Detection Continued
- Each of the following--when present in excessive
amounts--can result in water pollution - Organic wastes from domestic and industrial
sources - Infectious agents from domestic and industrial
wastes - Plant nutrients that cause nuisance growths
- Synthetic-organic chemicals such as detergents
- Inorganic chemical and mineral sources from
mining / manufacturing - Radioactive pollution and temperature increases.
41
Water Quality
- USGS operates two national stream water quality
networks. - Hydraulic Benchmark Network (HBN).
- National Stream Quality Accounting Network
(NASQAN). - Streams in watershed monitored to provide
descriptions of stream water quality conditions. - Understand effects of natural environment and
human activities on water quality.
(USGS)
63 physical, chemical, and biological properties
monitored during 60,000 stream visits
42
USGS Hydrologlic Units Map
- U.S. divided into successively
- smaller hydrologic units.
- 21 major geographic areas
- Drainage area of major river
- Combined drainage areas of series of rivers
- 222 subregions
- Area drained by river system
- Reach of a river and tributaries.
- Closed basins
- Group of streams forming coastal drainage areas.
- 352 hydrologic accounting units
- Cataloging unit
(USGS)
43
Environmental Assessment
- Many human activities produce potentially adverse
environmental effects, such as - Highways, railroads, pipelines
- Airports
- Industrial sites
- Power plants and transmission lines
- National Environmental Policy Act (NEPA)
established as national policy the creation and
maintenance of conditions that encourage harmony
between people and their environment. - Environmental impact statements prepared for
federal action having significant impact on
environment. - Remote sensing and image interpretation can be
used to assist in all of the related areas - Emergency response planning
- Landfill monitoring
- Permitting and enforcement
- Natural Disaster mitigation.
44
USGS Tracking Environmental Change
- Lake Chad on edge of Sahara
- Desert.
- Borders four countries in West Africa.
- Was once the sixth-largest lake in the world, but
drought has shrunk it to one-tenth its former
size. - Flat and shallow, so small changes in depth mean
huge change in area - Was once highly productive and supported
diversity of wildlife.
Landsat 1 MSS bands 4, 2, 1 (1973)
(USGS)
45
Wetland Mapping
46
Flood Damage Estimation
July 1992
- Scientific Assessment and Strategy Team (SAST)
established to provide scientific advice and
assistance regarding flood recovery in upper
Mississippi River Basin. - Natural flood plains
- Levies, dams, and dikes
July 1993
(USGS)
47
Image Interpretation Process Wrapup
- Through analysis, an image interpreter can
identify different terrain conditions and
determine the boundaries between them. - Topography
- Drainage pattern and texture
- Erosion
- Image Tone
- Vegetation
- Land use
- Above elements considered individually and in
combinations to estimate terrain conditions. - Image interpretation is readily used in examining
bedrock types - Geologic origin and formation
- Soil and/or bedrock characteristics
- Implications for land use planning
- Image identification.
48
(Photogrammetry)
49
(Photogrammetry)
50
(Photogrammetry)
51
Supplemental References
- NASA Goddard Remote Sensing Tutorial
http//rst.gsfc.nasa.gov/intro/Part2-12.htm - National Oceanic and Atmospheric Administration
(NOAA)http//www.noaa.gov/satellites - Smithsonian Educational Datahttp//www.nasm.edu/c
eps/research/cook/topography.htm - Geomatics Horizonshttp//www.sli.unimelb.edu.au/H
orizons/tnotes.html - U.S. Geological Survey (USGS)http//www.usgs.gov/
wrd002.html - Photogrammetryhttp//www.sli.unimelb.edu.au/nicol
e/lectures/lecintro.html - Principles of Photogrammetry, R. Lathrop with
Material from Avery and Berlin, 5th
Editionhttp//deathstar.rutgers.edu/courses/airph
oto/airphoto7/sld001.htm
Recommended
CrystalGraphics Presentations


