
FY03 Warfighter Technical Council WTC IPR PowerPoint PPT Presentation
1 / 25
Title: FY03 Warfighter Technical Council WTC IPR
1
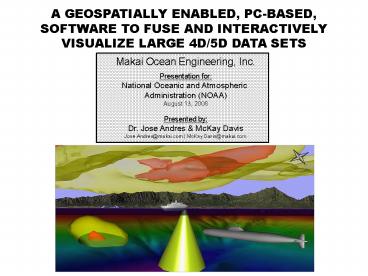
A GEOSPATIALLY ENABLED, PC-BASED, SOFTWARE TO
FUSE AND INTERACTIVELY VISUALIZE LARGE 4D/5D DATA
SETS
Makai Ocean Engineering, Inc. Presentation
for National Oceanic and Atmospheric
Administration (NOAA) August 13, 2008 Presented
by Dr. Jose Andres McKay Davis Jose.Andres_at_maka
i.com McKay.Davis_at_makai.com
2
MAKAI OCEAN ENGINEERING
- Located on Oahu, Hawaii
- Areas of expertise
- GIS / Visualization Software
- Submarine CablePlanning Installation Software
- Ocean Renewable Energy
3
PROBLEM ADDRESSED EXISTING APPROACH
- Understanding 3D/4D large data sets
- Currently visualized using 2D layers
- True 3D/4D visualization currently performed on
large supercomputer clusters
2D VIEWS
4
TECHNICAL CHALLENGE LIMITATIONS OF 3D/4D
VISUALIZATION (VOLUME RENDERING)
- Images terrain are associated with pixels (X,
Y, color/value) i.e., 2D images - 4D/5D is associated with a voxels (X, Y, Z, time,
multiple values) - Demands on memory to render 3D/4D data are two
orders of magnitude greater than what is
currently available with PC technology
5
NAVY APPLICATIONS (NAVOCEANO)
July 7
25 June
26 June
Regional Acoustic Assessment (Pd)
SNR transform to Pd (W.A. Albersheim)
MSRC
UNCLASSIFIED
6
ADVANCED CAPABILITIES (NAVOCEANO)
Probability of Detection (Pd) Map Varying in Time
Volume View for 5-25 July 06 Indicates Sea
Glider position every ¼ day
UNCLASSIFIED
7
WHAT ARE WE DEVELOPING?
8
MAKAIS GOALS
State of the Artalgorithms tovisualizeLARGE
amountsof volumetric datain a 3D/4D
interactivevirtualenvironment.
- Terrain volumetric visualization of large
databases - Fusing data from DIFFERENT sensors and databases
- One single display can render 200 MILLION data
points - Software allows for TIME VARYING data
- DISPLAYED ON PCs, not supercomputers
9
MAKAIS TECHNICAL APPROACH
- Makais visualization method is expected to be
two orders of magnitude faster than conventional
methods.This is achieved by using
- Semi-transparent colored iso-surfaces ? FAST
- New multi-threading capabilities of PC processors
- Tiling technology for terrain, imagery
volumetric data - Continuous Level of Detail (CLOD)
- Compression techniques to minimize file sizes
RESULT We can use PCs instead of supercomputers
10
Funding History
- CEROS (2006-2007)
- Algorithms development and basic PC-based
software - Proof-of-concept to retrieve data from remote
locations - ONR (2008)
- Enhanced, stand-alone PC based system
- Platform independent
- Spherical mapping
- Multiple formats (e.g. , netCDF)
- Multi-layers?
11
SAMPLE SCREENSHOTS
12
SAMPLE SCREENSHOT
13
Current Development (movie)
14
WHAT DATA CAN BE VISUALIZED?
- Terrain/bathymetry and imagery at very high
resolution - Sensors, moving assets, tracking targets
- Any variable (scalar or vector) that changes in
X, Y, Z, time - Very large datasets (GB to TB)
- Interactive visualization (gt 20 fps) on a desktop
PC - All data is geo-referenced
- Interface (I/O) with other GIS systems
15
CURRENT TECHNOLOGY
- Google Earth
- Web-based, interactive geospatial application
- Used for elevation and imagery data
- Cannot show bathymetry or time dependent
volumetric data
ArcGIS Explorer (by ESRI)
- True GIS platform
- Used for viewing spatial data, creating maps, and
perform spatial analysis - Mainly for 2D data
- Not highly interactive, even for small 3D/4D data
sets
16
NOAA INVOLVEMENT
- We would welcome the opportunity to work with
NOAA to identify specific areas of application. - Participating in our development, NOAA has the
opportunity to shape our development to better
fit your needs. - Our development efforts would greatly benefit
from your input and your technical and program
support.
17
- END
18
(No Transcript)
19
GOALS for 2008-2009 A CEROS PROJECT
- Enhance data pre-processing software
- Develop Client-Server management software
- Develop advanced analysis tools (e.g., ESRI
interfaces) - Generate geo-referenced outputs for Command
Control
20
Comparison with other NAVO Tools
- Makais 4D Visualization software will include
- Advanced terrain visualization ( Google)using
tiling, CLOD, import multipleimages, GIS shape
CAD files in thescene, track moving targets,
tools tocreate labels, routes and polygons,
additionof 3D objects, measure distances, load
geo-referenced points from files, etc. - 3D/4D visualization Show iso-surfaces,
truevolume rendering and flow visualization in
avariety of formats (NetCDF, ASCII,
binary)using 32/64 bit processing, tiling, CLOD,
andlatest GPU technology. Develop a variety of
tools such as perform math operations with
datasets, cutting slices and planes, measure
distances between iso-surfaces, render data from
sensors. - Provide a high performance 3D graphics toolkit
(i.e., OSG - used by application developers in
the fields of visual simulation, games, virtual
reality and modeling) to better control and
enhance the scene.
21
Expansion Possibilities
- Include the ability to access data on-demand from
a centralized or distributed server(s) network. - Expand capabilities to visualize real-time data
from sensors. - Specific applications for NAVY (ASW, NSW, MWC,
etc.)
22
Battlespace on Demand(The Three Tiers)
All Tiers to be developed simultaneously
Tier 3 the Decision Layer
- Options / Courses of Action
- Asset Allocation / Timing / Risk
- GOAL Provide Information via Web
Services and scheduled, tailored
push products
Tier 2 the Performance Layer
Tier 1 the (forecast)
Environment Layer
Initial and Boundary Conditions
UNCLASSIFIED
23
MAKAI APPROACH - 1
- New visualization method is expected to be two
orders of magnitude faster than conventional
methodsThis is achieved by using
- New Multi-threading capabilities of PCs
- Compression techniques to minimize file sizes
24
MAKAI APPROACH - 2
- Tiling technology for terrain, imagery
volumetric data - Semi-transparent colored iso-surfaces ? FAST
25
MAKAI APPROACH - 3
- Continuous Level of Detail (CLOD) once tile is
loaded in memory - RESULT We can use PCs instead of supercomputers
Recommended
