
ICO composite indicator price Annual average: 1966 to 2002 - PowerPoint PPT Presentation
1 / 18
Title:
ICO composite indicator price Annual average: 1966 to 2002
Description:
Annual averages: 1966 to 2002. Average of 2nd and 3rd positions in the ... Calendar years 1965 to 2001. Addressing the crisis: On the supply side: ... – PowerPoint PPT presentation
Number of Views:66
Avg rating:3.0/5.0
Title: ICO composite indicator price Annual average: 1966 to 2002
1
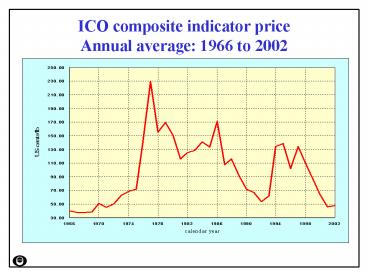
ICO composite indicator priceAnnual average
1966 to 2002
2
Group indicators Colombian Milds and Brazilian
Naturals Annual averages 1966 to 2002
3
Group indicators Other Milds and RobustasAnnual
averages 1966 to 2002
4
Average of 2nd and 3rd positions in the New York
and London marketsAnnual averages 1966 to 2002
5
Total productionCrop years 1966/67 to 2002/03
6
Total production by type of coffeeCrop years
1966/67 to 2002/03
7
Total exports by exporting countriesCalendar
years 1966 to 2002
8
Total exports by type of coffeeCalendar years
1966 to 2002
9
Total imports by importing countries Calendar
years 1966 to 2002
10
Consumption in importing countries Calendar
years 1966 to 2002
11
World consumption Calendar years 1966 to 2002
12
Gross opening stocks in exporting countriesCrop
years 1966/67 to 2002/03
13
Inventories and stocks (in importing countries
and in free ports)at the end of December 1966
to 2002
14
Supply and demandYear commencing 1966 to 2002
15
Value of exports of all forms of coffeeCalendar
years 1966 to 2002
16
Value of coffee exports as a percentage of the
value of exports of all commoditiesCalendar
years 1965 to 2001
17
Addressing the crisis
- On the supply side
- Coffee quality-improvement programme
- Diversification
- Production monitoring
- Sustainable economy
- On the demand side
- Promotion increasing coffee consumption through
market development - Barriers to trade
18
Actions to improve coffee quality ICC
Resolution no. 407
- Exporting Members shall not export coffee that
- for Arabica, has in excess of 86 defects per
300g sample (New York green coffee
classification/Brazilian method, or equivalent) - for Robusta, has in excess of 150 defects per
300g (Vietnam, Indonesia, or equivalent) - for both Arabica and Robusta, has a moisture
content below 8 percent or in excess of 12.5,
measured using the ISO 6673 method.
Recommended
CrystalGraphics Presentations


