
Spatiotemporal slip distribution around the Japanese Islands deduced from Geodetic Data - PowerPoint PPT Presentation
1 / 21
Title:
Spatiotemporal slip distribution around the Japanese Islands deduced from Geodetic Data
Description:
0:1:2:3:4:5:6:7:8:9:::;: :=: :?A:B:C:D:E:F:G:H:I:J:K:L:M:N:O:P:Q:R:S:T:U:V: W:X:Y: ... : : : : : : : : : : : : : : : : : : : : : : : : : : : : : :P: : : : : : : : : : ... – PowerPoint PPT presentation
Number of Views:85
Avg rating:3.0/5.0
Title: Spatiotemporal slip distribution around the Japanese Islands deduced from Geodetic Data
1
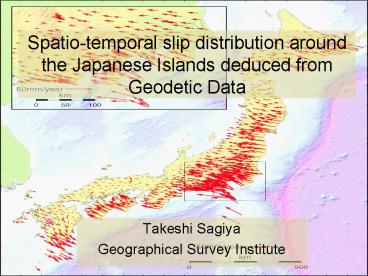
Spatio-temporal slip distribution around the
Japanese Islands deduced from Geodetic Data
- Takeshi Sagiya
- Geographical Survey Institute
2
Earthquake Simulations and Data Assimilation
- Earthquake phenomena occur in the real world.
- Incorporation of observational information is
indispensable in order to make a forecast using
simulation models. - What data can be assimilated?
- How can we assimilate those data?
3
Observation Data in Earthquake Studies
- Seismicity
- Related to stress
- Seismicity rate ltgt stressing rate
- LURR
- Assimilation model needs global applicability
- More studies needed.
- Crustal deformation
- Well established model
- Maruyama, Okada, etc.
- Groundwater, SEMs,
- Needs for establishing quantitative model
4
Assimilation of Deformation Data
- Deformation data can be modeled in terms of
stress/strain change in the earth. - Dislocation theory, FEM, FDM, etc.
- GPS and InSAR provide deformation data with good
accuracy and high (spatially and temporally, but
not enough) resolution. - Conventional geodetic data are available for more
than a century, which is comparable to a typical
recurrence interval of subduction earthquakes.
5
Assimilation of Geodetic Data
- Limitations
- Observations only at the Earths surface
- Estimate on internal stress/strain/slip has
limited resolutions. - Assumptions are necessary
- Deformation caused by slip (or slip deficit) on
the fault (or plate boundary). - Fault configuration needs to be assumed.
- Isotropic elastic half-space is assumed in many
cases. - Underdetermined problem
- Introduce a priori constraints
6
GPS Data
- Daily coordinates
- Accuracy 2-3mm Horizontal, 10-20mm vertical
- Near real-time 2-14 days time lag
- Average site interval in Japan 20-25km
- Network solution
- systematic errors
2000 Wesrwen Tottori Earthquake (Mw6.6)
Length
EW
NS
Velocity
UD
GPS site
7
Vertical data by GPS
- High temporal resolution
- Rate estimates is getting reliable
- Problems
- Seasonal signal
- Large scattering
- Local effects, artificial subsidence
- Comparison with InSAR will be a good solution.
8
Leveling Data
- Relative height change between neighboring
benchmarks - High (2km) spatial resolution along leveling
routes. - Poor (1-10years) temporal resolution
- Almost uniform quality for 100 years
- Systematic errors
- Still provides the best accuracy for vertical
9
Horizontal Movements of Japan revealed by GPS
Exaggeration X500,000
Earthquakes(Mgt5)
10
Data Assimilation with deformation data
- Representation theorem
- Observational equation
- Response functions G includes time-dependent
effects (viscoelasticity). - Linear equation is to be solved.
- A priori constraints on smoothness
- ABIC minimum criterion for optimum solution
11
The Nankai Trough and the Philippine Sea Plate
Subduction
2001 M6.7
1923 M7.9
1996 M6?
1944 M8.1
1946 M8.3
1997 M6.6
- Deformation can be attributed to slip (or slip
deficit) on plate boundary interface.
12
1996 Boso Silent Earthquake
- Detected by continuous GPS monitoring
- Up to 20mm displacements within a week
13
Inversion of A Slow Earthquake
- Inversion of daily coordinates at 30 GPS stations
- Elastic response functions
- Constraints on spatio-temporal smoothness
- Attribute to plate interface
- Slip migration
14
2001 Tokai Slow Event
Estimated source region of the Tokai Earthquake
Hamamatsu(93054)
Please check our updates at http//cais.gsi.go.jp/
tokai/ (Captions in Japanese only, sorry)
15
2001 Tokai Slow Event
- Moment release comparable to a M6.7 earthquake
- Slip may slow down and slightly migrate to the
east recently.
Results by Ozawa et al. (2002)
16
Tokai Slow Events Recorded in Legacy Data
After Kimata and Yamauchi(1998)
17
Earthquake Deformation Cycle
- Coseismic, postseismic, and interseismic
deformations documented by leveling in Shikoku
Island, southwest Japan
18
Viscoelastic Inversion of Earthquake Deformation
Cycle
- Data analyzed
- Vertical displacement in Shikoku and surrounding
areas - Parameters estimated
- Spatio-temporal distribution of slip rate on the
plate interface - All the parameters for 100 years are estimated at
once. - Response functions
- Viscoelastic
- Analytically calculated from a layed structure
19
Viscoelastic Inversion of Earthquake Deformation
Cycle
- Preliminary results
- Spatio-temporal distribution of slip deficit
(blue color corresponds to plate locking) - Optimum solution is not yet obtained
20
Obstacles in Data Assimilation Problems to be
solved
- BEM-type problem
- Need to solve a dense matrix
- Parallelization
- Assimilation in a spatio-temporal space
- Large number of parameters/data
- Kalman filtering
- Viscorlastic (time-dependent) response functions
applicable? - Faults/PBs may not be the only sources of
deformation. - Only gives us kinematic conditions
- Interpretation is not straightforward
21
Asperities and Slip Deficits on Plate Boundary
- Interpretation of kinematic Inversion results is
not straightforward. It may not be a direct
indication of mechanical coupling.
Recommended
CrystalGraphics Presentations


