
Sect. 8 Binary Phase Equilibria PowerPoint PPT Presentation
1 / 28
Title: Sect. 8 Binary Phase Equilibria
1
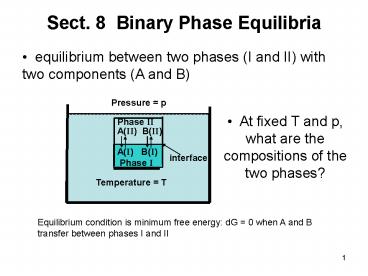
Sect. 8 Binary Phase Equilibria
- equilibrium between two phases (I and II) with
two components (A and B)
Pressure p
- At fixed T and p, what are the compositions of
the two phases?
Phase II
A(II) B(II)
A(I) B(I) Phase I
interface
Temperature T
Equilibrium condition is minimum free energy dG
0 when A and B transfer between phases I and II
2
Methods of determining phase equilibria
- Analytic uses equality of chemical potentials
?AI and ?AII
?BI and ?BII
- applicable for a variety of phases I and II
- but, must know activity coefficients
- Graphical uses excess free energies
gI xAIgAI xBIgBI hIex ?smix,I
gII xAIIgAII xBIIgBII hIIex ?smix,II
- Applicable only to condensed-phase equilibria
- Nonideality contained in hex
- How to apply the criterion of chemical
equilibrium?
3
Chemical equilibrium between phases
at fixed T, p ? dG 0
dG dGI dGII 0
dGI ?AIdnAI ?BIdnBI dGII ?AIIdnAII
?BIIdnBII
dG ?AIdnAI ?BIdnBI ?AIIdnAII ?BIIdnBII
0
Species conservation dnAII - dnAI and dnBII
- dnBI
(?AI - ?AII)dnAI (?BI - ?BII)dnBI 0
But dnAI and dnBI are arbitrary
?AI ?AII
?BI ?BII
In general at equilibrium, the chemical
potentials of each component are equal in all
phases
4
Solution (L) - vapor (g) equilibrium
Phase II vapor (g) ?
Phase I soln (L) ?
?AL gAL RTln(?AxA)
Equating ?Ag and ?AL ?
When xA 1, ?A 1, pA pA,sat ? exp()
pA,sat
pA ?AxApA,sat
pB ?BxBpB,sat
5
Activities from equilibrium pressures
- pi/pi,sat ?ixi ai, the activity of i in the
solution
- is the Gibbs-Duhem equation obeyed?
6
Raoults Law gi 1 applies to - ideal
solutions, all concentrations - all solutions as
xi ? 1
Henrys Law all solutions gi ? gio as xi ? 0
Rule when A obeys Raoults law, B follows
Henrys law and vice versa why?
xAdln?A xBdln?B 0 if ?A 1, dln?A 0,
? dln?B 0 ?B const.
Check plots using xAdlnaA xBdlnaB 0
In both plots, the signs of the slopes are
correct But are the magnitudes? (see later)
7
PHASE DIAGRAMS
- T x plot showing phases present in a binary
system consisting of two condensed phases
- both single-phase and two-phase regions shown
- vapor phase ignored but each T-x point has
unique partial pressures of A and B - total pressure p not a variable little effect
on plot
- Phase rule for C 2, f 4 - ?
Ignore p f 3 - ?
- ? 1 (single phase) f 2 (T and x variable)
- ? 2 (two-phase) f 1 (specify T x is
phase-weighted average of the two phases)
- ? 3 (three phase) f 0 (T x fixed)
8
The effect of T on the free energy
(see also Sect 5)
- why does DgM gL - gS decrease with T?
(at constant p 1 atm)
dgL -sLdT vLdp dgS -sSdT vSdp
Subtract
(?DgM/?T)p -DsM - DhM/TM
integrate from TM to T
9
MELTING OF AN IDEAL C 2, P 2 SYSTEM
- activity coefficients ?AL ?AS ?BL ?BS 1
- equilibrium in 2-phase region ?AL ?AS ?BL
?BS
gAL RTlnxAL gAS RTlnxAS gBL RTlnxBL
gBS RTlnxBS
Use gL gS eqn from previous slide
with xAL 1 - xBL and xAS 1 xBS, M
melting
Define phase boundaries
solidus
liquidus
10
Melting of ideal A-B binary(cont)
Plot of liquidus and solidus equations
Increase T at constant xB
- First liquid appears when T reaches level of d
low xBL
- at level abc, liquid at a and solid at c are in
equilibrium relative amounts by the LEVER RULE
Basis 1 mole of A-B mixture at b contains xB
moles of B
fLfraction of xB moles as liquid
xB fLxBL (1-fL)xBS
or
- The last solid disappears when the temperature
reaches level e
(lever rule)
11
PHASE SEPARATION IN A NONIDEAL BINARY LIQUID
- At high T, single liquid
- As T reduced, liquid separates into
partially-miscible liquids LI LII
of different compositions
- Equilibrium criteria ?AI ?AII and ?BI
?BII
xBI
xBII
gA RTln(?AIxAI) gA RTln(?AIIxAII)
gB RTln(?BIxBI) gB RTln(?BIIxBII)
- assume nonideality is given by the
Regular-Solution model
(W same in LI and LII)
12
substitute into equilibrium equations using xA
1 - xB
by symmetry of equations about xB 0.5 xBII
1 - xBI
Both equations become
- for G gt 2, two solutions (xBI and xBII)
- for G lt 2, no solution (single-phase liquid)
- G 2 corresponds to the critical-solution
temperature
13
GRAPHICAL METHOD
THE COMMON TANGENT RULE
On a plot of the molar free energy of two phases
at equilibrium, the points of common tangency
give their compositions
gL xALgAL xBLgBL hLex ?smix,L
14
The proof
(Sect. 7)
For both L s dg ?AdxA ?BdxB,
or
Applying to solid and liquid
criterion of equilibrium ?Bs ?BL and ?As ?AL
Transfer xBL and xBs as points on the T xB
diagram
15
Melting of an Ideal C 2 system
- ideality hsex 0 and hLex 0
- arbitrary references gAS 0 and gBS 0
gS RT xASlnxAS xBSlnxBS
- Molar free energies of pure liquids relative to
pure solids
- gAL(1-T/TMA)DhMA and gBL(1-T/TMB)DhMB
gL xAL(1 T/TMA)?hMA xBL(1 T/TMB)?hMB
RT xALlnxAL xBLlnxBL
Method
1. Choose T between TMA and TMB
2. Plot gS and gL vs xB
3. Determine xBs and xBL from common tangent
4. Transfer xBs and xBL to T xB plot
5. Go to 1
16
(No Transcript)
17
Partially-miscible liquids or solids
- as in analytical version, use regular solution
model - hex WxAxB G W/RT pure species gA gB
0
(Glt0)
(G0)
18
(0ltGlt2, TgtT
(G gt2, TltT)
- Dsmix is always lt 0 stabilizes solution (g lt 0)
- ? lt 0 increases stability of the solution
- ? gt 0 decreases solution stability
- for large positive W (or low T), the two phases
appear
- gives phase diagram on slide 12
19
Composite Phase Diagrams
- contain 2 (or more) of the features of simple
diagrams
- complicated to handle analytically
gS WSxASxBS Dsmix,s
(gL gS from Sl. 8 gS 0)
gL xA(1-T/TMA)DhMA xB(1-T/TMB)DhMB
WLxALxBLDsmix,L
- ?S and ?L are both positive (otherwise, only
single-phase solutions would exist) and ?s gt ?L
- Compared to gs Vs xB, gLVs xB
- is deeper (because ?s gt ?L)
- decreases faster as T increases (because sL gt
sS)
20
both ?L and ?S are lt2 two-phase zones in both
A-rich and B-rich ends
GW/RT
GS gt 2 causes separation into two solid phases of
the same crystal structure but different
compositions no liquid
21
Eutectic phase diagram
- g vs xB for system with one liquid and two solid
phases, a and b (different crystal structures)
- T6(high) ? T1(low)
- as T ?
- liquid curve drops faster than solid curves
- b curve rises faster than a curve
- Transfer compositions at ends of tangency lines
to T xB plot
22
- at k eutectic (low-melting in Greek)
- Only point where three phases are present
- Solid a at j
- Solid b at l
- Liquid at k
- omj acej are the terminal solubility of B in
a-A
- pnl bhl are the terminal solubility of A in b-B
- between omj and pnl is two-phase region where ?
and ? coexist this is a lopped-off version of
the diagram on sl. 12
- The L ? and L ? two-phase regions
abbreviated versions of the ideal-melting diagram
on sl. 11
- (1) and (2) represent cooling from the liquid at
constant xB
23
b?L
g?L
a?b Pure Zr
b?g
Zr2xU
24
- What phases occur as oxygen is added to
initially pure Zr at 1100oC ?
- three phases of ZrO2 appear as T?
- In pure Zr, a?b at 860oC
- for 0.2ltxOlt0.3, a-Zr is stabilized up to melting
at 2000oC
25
- UO2 stable up to its melting point
- limited solubility of ZrO2 in UO2
- as in all binary phase diagrams, 2-phase zones
are bordered by single phase regions, and vice
versa
26
Fe/O phase diagram
27
(No Transcript)
28
FREEZING POINT DEPRESSION
equilibrium of water ?WS ?WL
gWS gWL RTln(?WLxW)
the liquid is dilute is salt
? xW 1 xSalt ?1, ?W 1
RTxsalt
DhWM DT/TWM
Freezing-point depression
?hWM 6000 J/mole TWM 273 K
120 g NaCl in 1 liter H2O ? xsalt 0.036? DT
-3.7oC
Recommended
