
Powerpoint PowerPoint PPT Presentations
All Time
Recommended
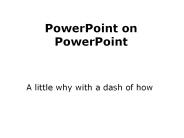
PowerPoint on PowerPoint A little why with a dash of how Why make PowerPoint presentations? easy to create and store portable attractive and versatile editable IMPACT ...
| PowerPoint PPT presentation | free to download

You can insert clip art pictures that come with PowerPoint. ... How do you insert a PowerPoint clip art picture? ... Inserting a PowerPoint Clip Art Picture ...
| PowerPoint PPT presentation | free to view

Download Peripheral Artery Disease Powerpoint Template with easy editable- http://goo.gl/tU0yAG

Repair PowerPoint file to recover corrupted PPTX file. Recover Corrupted PowerPoint file to get data from damaged PowerPoint file with original formatting,use this PowerPoint File Repair Tool. Recover PowerPoint file with advanced features of this PPTX Repair Tool. Repair Corrupted PowerPoint file and get it into a healthy format.
| PowerPoint PPT presentation | free to download

0 Note that the following lectures include animations and PowerPoint effects such as fly ins and transitions that require you to be in PowerPoint's Slide Show mode
| PowerPoint PPT presentation | free to view

PowerPoint Tips. 5. Applying a background template ... PowerPoint Tips. 6. Changing colors ... PowerPoint Tips. 14. Changing the font, font size and font color ...
| PowerPoint PPT presentation | free to view

CrystalGraphics.com PowerPoint Templates
| PowerPoint PPT presentation | free to download

Microsoft PowerPoint
| PowerPoint PPT presentation | free to view

Conociendo PowerPoint
| PowerPoint PPT presentation | free to download

PowerPoint Presentations TLC - Business How to Create a Slide Presentation Start Menu Programs Microsoft PowerPoint Choose which new document you want by ...
| PowerPoint PPT presentation | free to download
... Like a PowerPoint Pro. Building your ... Think of PowerPoint Slides as 3D Objects. Load the 'Draw' tool bar. Turn the ' ... 'Advanced PowerPoint Seminar' David ...
| PowerPoint PPT presentation | free to download

Most of the people don't know how a powerpoint appears , so i have uploaded sample document to know how a powerpoint appears.
| PowerPoint PPT presentation | free to download

Slide Bazaar offers you to get free PowerPoint Templates - helpful to make your presentations more attractive. Visit our website to access more than 9,000 graphic designs for PowerPoint & templates.https://bit.ly/2GwIHFa
| PowerPoint PPT presentation | free to download
Title: PowerPoint Tutorial Author: Alexander Ivan Alvarez Last modified by: Janice Wing Created Date: 10/20/2005 10:41:14 PM Document presentation format
| PowerPoint PPT presentation | free to download
PowerPoint Presentations. By April Icsman. Why PowerPoints? Adds color, sound, and ... powerpoint. text. sound. images. executive. judicial. legislative ...
| PowerPoint PPT presentation | free to view

Nowadays people like to use powerpoint easily , so our company have a organised a special method for easy use of power point.
| PowerPoint PPT presentation | free to download

PowerPoint Tips. Linda Baker. 4/19/09. 2. PowerPoint Introduction. Open PowerPoint. 4/19/09 ... Content Tips. No more than 2-3 lines for each item. Fonts: ...
| PowerPoint PPT presentation | free to view

PowerPoint Clip Art. HSC IT Center Training. University of Florida. Browse. Search ... PowerPoint. Choose a blank layout. Insert Picture Clip Art...
| PowerPoint PPT presentation | free to view

PowerPoint Tips. Guidelines for Effective Presentations. Tips to be ... For more PowerPoint tips, ideas and assistance visit Microsoft Office Online at: ...
| PowerPoint PPT presentation | free to view

PowerPoint Instructions. Content Main Points. The major points of your research ... PowerPoint should supplement what you say, not be your presentation. Speech ...
| PowerPoint PPT presentation | free to view

Light font on light background. Powerpoint Clip Art and Graphics. Should balance the ... Check out the ITS free classes. ITS PowerPoint Classes ...
| PowerPoint PPT presentation | free to view

Title: PowerPoint Presentation Last modified by: Mike Butler Created Date: 1/1/1601 12:00:00 AM Document presentation format: On-screen Show Other titles
| PowerPoint PPT presentation | free to view

Advanced Powerpoint. Presentation Balance. Clip Art Sound. COMPETE CONTROL ... very easily create a PowerPoint so that your clip art will appear to put ...
| PowerPoint PPT presentation | free to view

Add clip art to s. Reorganize s. Presenting tips. Advanced PPT skills (some! ... PowerPoint offers twenty-four layouts. First is 'Title Slide' ...
| PowerPoint PPT presentation | free to view

Powerpoint Rules Adding to your Presentation Purpose of a Powerpoint Tool to help audience remember message Visual learners stay attentive Used as an outline Know ...
| PowerPoint PPT presentation | free to download

PowerPoint shares MS Office features like menus, toolbars ... Free Online PowerPoint Tutorials. http://www.orst.edu/instruction/ed596/ppoint/pphome.htm ...
| PowerPoint PPT presentation | free to view

Layout Sample 1. Victory posters. Layout Sample 2. Color. The ... Why Most PowerPoint Presentations Suck by Rick Altman. Show Me the Numbers by Stephen Few ...
| PowerPoint PPT presentation | free to download

Presenting PowerPoint. Order Your Thoughts. Retain People's ... More on PowerPoint. Use Various Backgrounds , Colors and Fonts. Animation Use. Use Sound ...
| PowerPoint PPT presentation | free to view

PowerPoint Animations. Making stuff move.... 2. Possibilities. Slide Transitions ... Previewing Custom Animation. To check effect: Click Play or Slide Show at ...
| PowerPoint PPT presentation | free to view

PowerPoint TUTORIAL. Creating a PowerPoint Presentation. Thanks for viewing this Tutorial. Any questions, comments or complaints can be registered at the next class ...
| PowerPoint PPT presentation | free to view

PowerPoint Tips & Tricks. itlTV Webcast. http://www.accc.uic.edu/seminars/ppt-tips. Importing Text. You can create an outline in another program and import it ...
| PowerPoint PPT presentation | free to view

Title: POWERPOINT JEOPARDY Subject: Jeopardy Template Author: Educational Technology Network Keywords: Jeopardy Powerpoint Template Educational Technology

Title: POWERPOINT JEOPARDY Subject: Jeopardy Template Author: Educational Technology Network Keywords: Jeopardy Powerpoint Template Educational Technology

Title: POWERPOINT JEOPARDY Subject: Jeopardy Template Author: Educational Technology Network Keywords: Jeopardy Powerpoint Template Educational Technology

Title: POWERPOINT JEOPARDY Subject: Jeopardy Template Author: Educational Technology Network Keywords: Jeopardy Powerpoint Template Educational Technology

Title: POWERPOINT JEOPARDY Subject: Jeopardy Template Author: Educational Technology Network Keywords: Jeopardy Powerpoint Template Educational Technology

Title: POWERPOINT JEOPARDY Subject: Jeopardy Template Author: Educational Technology Network Keywords: Jeopardy Powerpoint Template Educational Technology

Title: POWERPOINT JEOPARDY Subject: Jeopardy Template Author: Educational Technology Network Keywords: Jeopardy Powerpoint Template Educational Technology

Title: POWERPOINT JEOPARDY Subject: Jeopardy Template Author: Educational Technology Network Keywords: Jeopardy Powerpoint Template Educational Technology

Title: POWERPOINT JEOPARDY Subject: Jeopardy Template Author: Educational Technology Network Keywords: Jeopardy Powerpoint Template Educational Technology
powerpoint 2010
| PowerPoint PPT presentation | free to download

CrystalGraphics 3D Character Slides for PowerPoint
| PowerPoint PPT presentation | free to view

Featuring business meeting PowerPoint template - designed to cover all activities and reports in a mannered way to better represent your workflow and product. SlideBazaar offers you to download a range of professional powerpoint template for free. https://bit.ly/2EyA22F

Ever felt frustrated with Microsoft PowerPoint? Adopt the latest simple way of using Powerpoint templates that make your presentations unique and engaging. SlideBazaar has a wide range of premium quality professional templates that present your information in a well understandable way. https://bit.ly/2GwIHFa

Meetings Powerpoint Content
| PowerPoint PPT presentation | free to view
Rhetoric Of PowerPoint Julia Romberger 04.05.07 English 435/535 Presentation Overview Physical Presentation PowerPoint Content PowerPoint Visuals Physical ...
| PowerPoint PPT presentation | free to download
Download PowerPoint templates and Keynote s for creating high-quality and stunning presentations in less time.
| PowerPoint PPT presentation | free to download
Making PowerPoint Slides Avoiding Bad Slides * * What are we learning about? Lesson Objectives Presenting Skills PowerPoint Tips Questions * Presenting Skills Avoid ...
| PowerPoint PPT presentation | free to download

http://www.mybusinessvisual.com/ It is hard for you to find equal good creative powerpoint presentation service with attractive rates for powerpoint production and powerpoint presentation enhancement anywhere in the world. Our production team is well qualified and professionally trained by our specialized trainers. We assure quick turn around time even without prior reservation of capacity. Furthermore our overnight powerpoint production support helps our clients to send their work before they leave the office in the evening and simply get their ready PowerPoint presentation on the following day morning.
| PowerPoint PPT presentation | free to view

Creating PowerPoint Presentations Content and Visuals for Presentations ...
| PowerPoint PPT presentation | free to view

Intro to PowerPoint PowerPoint Assignment Create a Power Point Slideshow that includes: 6-10 s using the same design template Italics, Underline, and Bold At ...
| PowerPoint PPT presentation | free to view
Making PowerPoint Slides Avoiding the Pitfalls of Bad Slides Name and affiliation? Tips to be Covered Outlines Slide Structure Fonts Colour (or Color?)
| PowerPoint PPT presentation | free to download

PowerPoint for Posters Cynthia ... Tips Use text boxes and charts ... Have at least a couple people review your poster for typos and readability. Sample posters ...
| PowerPoint PPT presentation | free to download

http://www.mybusinessvisual.com/ MyBusiness Visual India Private Limited (MBV) is a PowerPoint presentation designing company based in India. We proud ourselves as a pioneer in presentation designing, to enable clients to outsource/offshore their powerpoint presentation in order to make it as a professional quality presentation. our aim is “to support our clients in the graphical part of their day-to-day business presentations thereby giving the viewers the optimal message with highest professional standard
| PowerPoint PPT presentation | free to view
Making PowerPoint Slides Avoiding the Pitfalls of Bad Slides Titles and Headings The main topic should be the Heading see above Have at least one for each topic.
| PowerPoint PPT presentation | free to download

Microsoft PowerPoint 2003. Download Design Templates. on Microsoft Office Online ... display in PowerPoint. Title Slide ... View New Template in PowerPoint ...
| PowerPoint PPT presentation | free to view