
Dose Response Modeling - PowerPoint PPT Presentation
1 / 1
Title:
Dose Response Modeling
Description:
Mention of trade names or commercial products does not constitute endorsement or ... EPA guidance and the state-of-the-art in chemical risk assessment, ORD plans ... – PowerPoint PPT presentation
Number of Views:591
Avg rating:3.0/5.0
Title: Dose Response Modeling
1
Dose- Response Modeling Jeff Gift1 and R. Woodrow
Setzer1 Contributors Kenneth G. Brown2 Gary
Foureman1, John Fox3 Yiliang Zhu4 1U.S.
Environmental Protection Agency, Office of
Research and Development, Research Triangle Park,
NC 2KBinc., Chapel Hill, NC 3U.S. Environmental
Protection Agency, Office of Research and
Development, Washington, DC 4University of South
Florida
Impact and Outcomes
Future Methods/Approaches Under Consideration
Current Methods/Approaches In Use
Science Question
The Agency is charged by Congress with developing
health benchmarks that protect the public from
potentially harmful chemical exposures. Benchmark
dose methods are currently used or considered in
all Agency IRIS and most other program office
risk assessments. Over the past few years, the
Agency has made BMDS easier to use by improving
its user interface and modeling capabilities to
keep up with the state-of-the-science in this
important and growing risk assessment field
(Filipsson et al., 2003). At the same time, the
customer base for BMDS has expanded to over 2,000
registered users in areas of industry, academia
and government from over 80 countries. The
Agency plans to maintain and improve
dose-response modeling software such as BMDS and
CatReg so that they continue to provide a
valuable resources to Agency program office,
regional, State and international risk assessors.
What can be done to support Agency risk assessors
in their efforts to model and characterize
dose-response data for the purposes of Agency
risk assessments?
Figure 4
Figure 1
Research Goals
Longitudinal Data Dose- Response
Benchmark Dose
To answer this question the various study
designs, chemical modes of action and
dose-response shapes an assessor may encounter
need to be considered. Ongoing dose-response
modeling research and support activity within the
Agency can be divided into five areas (1)
accounting for various study designs risk
assessors will encounter, (2) accounting for a
chemicals mode of action (MOA) and the various
dose-response shapes an assessor will encounter,
(3) interpreting model results, (4) developing
user-friendly model interfaces, and (5) providing
guidance and training on the application of
models and the linkage of dose-response modeling
to risk assessment.
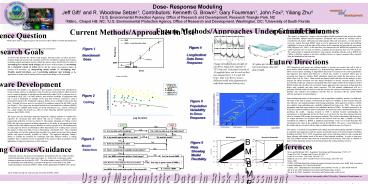
Future Directions
Change in hindlimb grip strength of rats after a
single dose exposure to TET (top row). Each panel
consists of 10 spaghetti lines, one for each rat
that was measured at 0, 2, 24, and 168 hours.
Data were fit by a toxico-diffusion model with
adjustment for individual variation (bottom row).
3D spline plot of relationship between ln(time),
dose and grip strength.
ORD laboratories and centers are working together
to develop new models that will be able to assess
studies which measure responses (e.g.,
neurotoxicology batteries) over time (Zhu et al.
(a), 2004). Dose-response modeling of
longitudinal data needs to account for the
control populations time-trajectory and capture
dose-effects in a critical time window as
exposure effects may be reversible (see Figure
4). Further, BMD calculation should also reflect
the time-course of toxic effects (Zhu et al. (b),
2004). Other models are planned which will allow
for the analysis of dose-response for effects
measured over time during subchronic or chronic
exposure studies, and for more flexible models
for continuous and quantal data. Future plans
include the development of EPA BMDS models that
will allow for a consistent Agency approach to
the assessment of chemicals that induce early
mortality and early tumor responses. The first
planned enhancement will be a multistage Weibull
model for times-to-event that accounts for
censored observations, having a user interface,
risk estimates and confidence intervals that are
consistent with the current BMDS software and
Agency recommendations. Some fundamental aspects
of dose-response, such as population variability,
remain to be addressed. The slope of the lines
in Figure 5 demonstrate the degree of variability
in dose-response that may exist between a test
animal population and a human population, either
general or sensitive, with the more shallow slope
indicating more variability (adapted from Evans
et al., 2001). There are also outstanding
statistical issues related to the calculation and
use of BMD. Research sponsored by an NCER has
explored confidence interval calculation and
sensitivity of the calculated interval to
mis-specifying the model. Ongoing research in
ORD is directed towards understanding the
consequences of and adjusting for the fact that
we do not know the true dose-response functions
when we estimate BMDs using dose-response
modeling. This results in uncertainty that
increases as we require inferences for responses
that are far removed from the data. A helpful
tool being considered for addition to BMDS is
graphical representation of the set of model
functions that correspond to the values in the
confidence interval for the BMD. This gives a
visual indication of the models that are
consistent with the data in a defined statistical
sense (see Figure 6). The Agency is currently
revising BMDS and CatReg and associated training
materials in response to comments and suggestions
made by Agency and outside experts at the
Dose-Response Modeling Workshop held July 30-31,
2002. Suggestions made at the workshop related to
both existing and future software and training
needs in the area of dose-response modeling. In
order to keep pace with EPA guidance and the
state-of-the-art in chemical risk assessment, ORD
plans to continue to improve these important
Agency tools and expand upon the existing
training resources.
Software Development
Benchmark dose (BMD) is an approach to
dose-response assessment first introduced by
Crump (Crump, 1984) as an alternative to the
NOAEL (no observed adverse effect level) for use
as a point of departure to calculate an allowable
daily intake (ADI) or reference dose or
concentration (RfD, RfC). In BMD analysis,
dose-response modeling of appropriate data sets
is used to interpolate an estimate of the dose
that would be expected to yield a prespecified
response (the benchmark response, BMR), and a
confidence interval for that dose. Typically,
the lower end of a one-sided 95 confidence
interval for the BMD is used (see Figure 1). The
Agency has developed models for its benchmark
dose software (BMDS) that account for standard
study designs involving dichotomous (e.g.,
tumor), continuous (e.g., organ weight) and
nested (e.g., effect in pups following parental
exposures) dose-response data (USEPA, 2000). The
Agency has also developed categorical regression
(CatReg) software to evaluate dose-responses for
chemicals that elicit effects that can be
evaluated over time and/or categorically graded
by severity (see Figure 2). The primary advantage
of CatReg over the BMD and other dose-response
modeling approaches is its ability to incorporate
data from multiple studies, and address exposure
duration as well as exposure level, all
simultaneously. A recent paper by Brown and
Strickland (2003) demonstrates how CatReg can be
used in this manner to bring more data to bear on
determining a benchmark dose. They evaluated
several studies of a specific endpoint data
(mortality) in a single species (rats) for
hydrogen sulfide, with options currently
available on CatReg. This approach illustrates
CatRegs ability to evaluate the potential for
combining data from different studies, a CatReg
capability that is expected to grow in
popularity as the Agency refines its guidance for
the application of categorical regression to
dose-response.
Figure 2
Figure 5
CatReg
Population Variability In Dose-Response
START
STOP
Yes
No
No
A. Are my data worth modeling?
Can I edit my data (e.g. drop high dose)?
Yes
No
No
B. Is my model appropriate for my data?
Try another model?
Figure 3
BMDL
Yes
Figure 6
No
C. Does my model fit the data?
Model Selection
References
Plots Showing Model Flexibility
Yes
Training Courses/Guidance
No
D. Have I considered all available model options?
Brown and Strickland, 2003. Regulatory
Toxicology and Pharmacology 37305317 Crump KS,
1984. Fundam Appl Toxicol. 4(5)854-71.Evans
JS, et al. 2001. Risk Anal. 21(4)697-717. Filips
son, AF, et al., 2003. Critical Reviews in
Toxicology, 33(5)505542. Setzer, 2004 USEPA,
2000 Benchmark dose technical support document
external review draft. Risk Assessment Forum,
Washington, DC EPA/630/R-00/001. USEPA, 2001.
Help Manual for Benchmark Dose Software Version
1.3. EPA 600/R-00/014F Zhu et al. (a), 2004.
Regulatory Toxicology and Pharmacology, in
press. Zhu et al. (b), 2004. Regulatory
Toxicology and Pharmacology, under review.
Yes
No
Ultimately, Agency risk assessors need guidance
and training in the use of these models, and the
interpretation of their results (see Figure 3).
To this end, a web-based, online training program
was developed by ORD. The online training course
for BMDS reviews the benchmark dose methodology,
consistent with the most recent draft of our BMD
technical guidance document (USEPA, 2000), and
the application of BMDS to the various types of
data sets that risk assessors may encounter
(USEPA, 2002).
D.2. Are BMDL estimates within a 3-fold range?
Use the lowest BMDL
Yes
BMR
No
Use avg. or geom. mean of BMDLs
D.3. Are AIC values different from one another?
Yes
E. Choose a BMR
Use BMDL from model that results in the lowest AIC
Recommended
CrystalGraphics Presentations


