
8 Guidelines for Critically Evaluating a Statistical Study - PowerPoint PPT Presentation
1 / 10
Title:
8 Guidelines for Critically Evaluating a Statistical Study
Description:
8 Guidelines for Critically Evaluating a Statistical Study Identify the Goal, Population, and Type of Study Consider the Source Examine the Sampling Method – PowerPoint PPT presentation
Number of Views:882
Avg rating:3.0/5.0
Title: 8 Guidelines for Critically Evaluating a Statistical Study
1
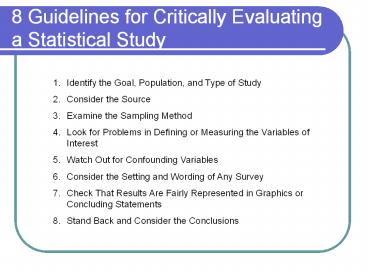
8 Guidelines for Critically Evaluating a
Statistical Study
- Identify the Goal, Population, and Type of Study
- Consider the Source
- Examine the Sampling Method
- Look for Problems in Defining or Measuring the
Variables of Interest - Watch Out for Confounding Variables
- Consider the Setting and Wording of Any Survey
- Check That Results Are Fairly Represented in
Graphics or Concluding Statements - Stand Back and Consider the Conclusions
2
Identify the Goal, Population, and Type of Study
- The goal should be stated precisely that is, who
or what is being studied and exactly what it is
wed like to learn about it. - Population complete set of people or things
being studied. - 3 Types of Studies Observational, Experiment,
Meta-Analysis
3
Consider the Source
- Who is conducting the study and why?
- Watch for researcher bias
- Peer review is a process in which several experts
in a field evaluate a research report before the
report is published.
4
Examine the Sampling Method
- Simple Random Sampling
- Systematic Sampling
- Cluster Sampling
- Stratified Sampling
- Convenience Sampling
- Multi-Stage Sampling
5
BIAS
- Researcher
- Sample
- Selection bias - researchers select ther sample
in a biased way - Participation bias occurs any time
participation in a study is voluntary - Self-selected or Voluntary Response survey
6
BIAS
- Data
- Experimental Controls
- Control Group
- Confounding Factors
- Placebo Effect
- Experimenter Effects
- Blinding
- Case-Control Studies
7
Watch Out for Confounding Variables
- If, for example, subjects in one group are
simultaneously tested in a room with the heat set
at 70 degrees whereas subjects in another group
are simultaneously tested in a nearby identically
appointed room with the heat set at 60 degrees,
the obtained differences in performance could be
attributed to any of three factors. It could be
due to the random assignment of subjects (i.e. to
chance). It could be due to the different
temperatures in the two rooms. It could, however,
be due to some confounding factor such as
differences in ambient illumination that result
from unnoticed differences in the orientation of
each room with respect to the sun. In any
experiment an appropriate statistical test can
help in the decision as to whether or not to
attribute the results to chance, but only the
most careful analysis of the actual conditions of
the experiment can suggest whether or not the
result might be due to a confounding factor.
8
Consider the Setting and Wording of Any Survey
- Do you think Pat cheated on her test?
- Dont you think Pat cheated on her test?
- Would you say that traffic contributes more or
less to air pollution than industry? - Would you say that industry contributes more or
less to air pollution than traffic?
9
BIAS
- Check That Results Are Fairly Represented in
Graphics or Concluding Statements - Watch the scale on the axes of graphs
10
Stand Back and Consider the Conclusions
- Did the study achieve its goals?
- Do the conclusions make sense?
- Can you rule out alternative explanations for the
results? - If the conclusions make sense, do they have any
practical significance?
Recommended
CrystalGraphics Presentations


