
Biomimicry - PowerPoint PPT Presentation
1 / 62
Title: Biomimicry
1
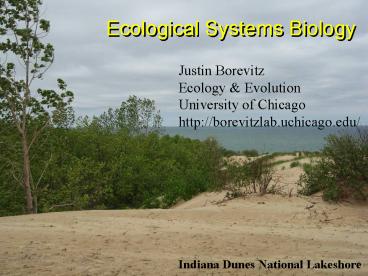
Ecological Systems Biology
Ecological Systems Biology
Justin BorevitzEcology EvolutionUniversity of
Chicagohttp//borevitzlab.uchicago.edu/
Indiana Dunes National Lakeshore
2
Genotype
Environment
Phenotype
http//farm1.static.flickr.com/7/9927631_aa10584e0
a.jpg
3
Variants under study
- Transgenetics 1
- Mutants 10
- Families 100
- Ancestral Populations 1,000
- Compatible Species 10,000
- Communities 100,000
- Ecosystems 1,000,000,000
- Biosphere 1,000,000,000,000
4
Talk Outline
Talk Outline
Genetic Diversity biodiverisity Population
structure, migration, admixture Phenotyping in
Natural environments Seasonal Variation in the
Lab Whole Genome Association Mapping Methylome,
tiling array expression Next Species Aquilegia,
Switchgrass Ecological plant communities Indiana
Dunes, Tall Grass Prairies
5
Local adaptation under strong selection
6
(No Transcript)
7
Seasonal Variation
Matt Horton
Megan Dunning
8
Variation within a field http//naturalvariation.o
rg/hapmap
Variation within a field http//naturalvariation.o
rg/hapmap
9
Genetic Structure
- Family Structure
- 100-1000 SNPs
- Deep racial historical population structure
- 10,000 SNPs
- Genetic Association
- causative gene
- 100k, 1M SNPs
10
Which genotyping tool should be used?
Yan Li
11
Diversitywithin andbetween populations
80 Major Haplotypes
Google Earth Fly By
12
Distribution of the common haplotype in USA
43/6368 of the sites in USA has this most
common haplotypeAmong big sites(nlinesgt10)
36/4286
Common haplotype sharing across sites in USA
Yan Li
of colors 629
13
Genetic Variation within aMidwest Field (PNA)
- Haplotype frequency differs across collection
dates
Yan Li
14
Geoff Morris
15
- Genetic tree (overall histogram, shared haplotyes
within and across regions)
Cluster of 5707 lines
Histogram of haplotype sizes 1799 unique
haplotypes in total among 5707 lines. 1323
singletons
Biggest Clone
Haplotype sizes
Singletons
Non-singleton groups(clones) at h0
16
Average Pairwise Haplotype Diversity
Alex Platt
17
Selecting mapping population
All data 5309 lines at 142 SNPs
1841 lines at 142 SNPs after removing clones
384 diverse lines (1 line from each of the 384
group)
Redundancy randomly chosen 25 lines from the
1680 unique lines (data1_5) will have 282
alleles141 SNPs x 2
Final 360 lines in seasonal flowering time
Yan Li
18
Summary
- Genetic Diversity
- Within and between populations
- Local, regional, global
- Phenotypic Diversity Adaptation
- New mutations
- New genetic combinations of existing alleles
- Evolution
- Colonization, expansion, and collapse
- In migration, recombination, diversity
19
Begin with regions spanning the Native Geographic
range
Lund Sweden
Nordborg et al PLoS Biology 2005 Li et al PLoS
ONE 2007
Tossa Del Mar Spain
20
Sweden Spain
Seasons in the Growth Chamber
Seasons in the Growth Chamber
- Changing Day length
- Cycle Light Intensity
- Cycle Light Colors
- Cycle Temperature
- Changing Day length
- Cycle Light Intensity
- Cycle Light Colors
- Cycle Temperature
Geneva Scientific/ Percival
21
Solar Calc II
Kurt Spokas Version 2.0a June 2006
USDA-ARS Website Midwest Area (Morris,MN) http//
www.ars.usda.gov/mwa/ncscrl
22
(No Transcript)
23
\
Seasonal Flowering Time Response
Seasonal Flowering Time Response
Kas/Col RILs Van/Col RILs 360 Diverse
Accessions Spain/Sweden Spring (early late)
Fall (early late)
24
\
Seasonal Flowering Time Response
Seasonal Flowering Time Response
Hybrid dwarf
25
Which arrays should be used?
Gene array
Exon array
Tiling array
35bp tile, 25mers 10bp gaps
26
Which arrays should be used?
SNP array
How about multiple species? Microbial
communities?
Pst,Psm,Psy,Psx, Agro, Xanthomonas, H parasitica,
15 virus,
Ressequencing array
Tiling/SNP array 2007 250k SNPs, 1.6M
tiling probes
27
Sweden
Spain
Spring
Summer
Yan Li
28
WGA seasonal Flowering time
Spain Spring
Sweden Spring
Chromosome 1
Chromosome 2
Spain Summer
Sweden Summer
Yan Li
29
eQTL Association Mapping
6000 gene traits x 250k SNPs
Andy Cal
30
eQTL Association Mapping
Andy Cal
31
Summary Arabidopsis
- Simulating Seasons in the lab
- Changing day length, end of day FR, temp
- Video phenotyping, growth rate and rhythm
- QTL mapping (Yan Li, et al PLoS ONE)
- G x E, suggests adaptive importance
- Epistasis, genetic background importance
- Whole Genome Association mapping
- Complex traits, complex genetic architecture
- Mendelian traits, simple to resolve
32
Universal Whole Genome Array
DNA
RNA
Gene/Exon Discovery Gene model correction Non-codi
ng/ micro-RNA
Chromatin Immunoprecipitation ChIP chip
Alternative Splicing
Methylation
Antisense transcription
Polymorphism SFPs Discovery/Genotyping
Transcriptome Atlas Expression levels Tissues
specificity
Comparative Genome Hybridization
(CGH) Insertion/Deletions Copy Number
Polymorphisms
RNA Immunoprecipitation RIP chip
Allele Specific Expression
Control for hybridization/genetic
polymorphisms to understand TRUE expression
variation
Xu Zhang
33
Potential Deletions
34
Potential Deletions Suggest Candidate Genes
FLOWERING1 QTL
Chr1 (bp)
Flowering Time QTL caused by a natural deletion
in FLM
(Werner et al PNAS 2005)
35
SFPs and CCGG Methylome
Genomic DNA
Col
HpaII digestion
Random labeling
Col
Genomic DNA
MspI digestion
Random labeling
Genomic DNA
Van
HpaII digestion
Random labeling
Van
Genomic DNA
MspI digestion
Random labeling
Full model Intensity genotype enzyme
genotype x enzyme
36
SFP detection on tiling arrays
Xu Zhang
37
Methylation polymorphisms are extensive
a Features of constitutive CG methylation bc
Features of Col- or Van-specific methylation df
cDNAs or promoters with feature(s) of enzyme
effect (p lt 0.1) or genotype enzyme
interaction (p lt 0.05) eg cDNAs or promoters
containing CCGG feature(s) h Intergenic
features (excluding cDNAs or promoters) of enzyme
effect (p lt 0.1) or genotype enzyme interaction
(p lt 0.05) i Intergenic (excluding cDNAs or
promoters) CCGG-containing features
38
Genic distribution of constitutive and
polymorphic methylation sites
39
Double-stranded random labeling
AAAAA
Random reverse transcription
AAAAA
Double-stranded cDNA
Random priming
40
Additive, dominant and maternal effects of gene
expression
41
de novo transcriptome variation
Xu Zhang
42
Correlation of polymorphic CG methylation and
gene expresson variation
43
Next Species.
Next Species.
Eco region diversity plant community population
genomics. Genetic variation within and between
species and locations Conservation
Genetics Restoration with high diversity
genotypes
44
Aquilegia (Columbines)
Recent adaptive radiation, 350Mb genome
45
Species withgt 20k ESTs 11/14/2003
Animal lineage good coverage
46
Aquilegia and pollinators
Justen Wittall Scott Hodges
Humming Bird Hawkmouth
Bumble Bee
47
Genetics of Speciationalong a Hybrid Zone
48
Christos Noutsos
49
Christos Noutsos
50
NSF Genome Complexity
- Microarray development
- QTL candidates
- Physical Map (BAC tiling path)
- Physical assignment of ESTs
- QTL for pollinator preference
- 400 RILs, map abiotic stress
- QTL fine mapping/ LD mapping
- Develop transformation techniques
- VIGS
- Whole Genome Sequencing (JGI?)
Scott Hodges (UCSB) Elena Kramer (Harvard) Magnus
Nordborg (USC) Justin Borevitz (U Chicago) Jeff
Tompkins (Clemson)
51
Habitats of the Indiana Dunes
Lakeshore Dune
Dune Flats
Blowout
Tallgrass Prairie
Oak flatwoods
Ruderal land
Black Oak Savanna
Geoff Morris
52
Microclimate stations
- 4 weather stations on ecotones
- 8 microclimate modules (2 per station)
2
1
Backdune
3
4
Foredune
Blowout
Flatwoods
Lake
SG
4
2
Panne
Interdune flats
3
1
Backdune ridge
SG
Geoff Morris
Interdune trough
53
Microclimate and plant community
- How, when, and where are plants stressed?
- How does this vary over the landscape?
- How do plants shape their own environment?
- Are particular grass genotypes found in
particular environments?
Geoff Morris
54
Microclimate moderation
- Interdune flat (No switchgrass)
- Interdune trough (Switchgrass)
- Windward backdune ridge
- Leeward backdune ridge
3.36 2.08 1.41 0.85
Soil temp Std
Air Soil Temp C
Geoff Morris
55
Succession Lake Michigan sand dunes
56
(No Transcript)
57
The Next Generation of Biofuels Greenhouse-Neutra
l Biofuels from High-Diversity Low-Input
Prairie Ecosystems by David Tilman University
of Minnesota
58
Nielsen and Hole, 1963
59
Real Time Ecosystem Monitoring
- HPWREN
- San Diego wireless ecological data sensing.
Fermilab AmeriFlux site, provided by Timothy J.
Martin (ANL-EVS)
60
Google Earth
- Gigapan.org
61
Remote Sensing (micro NEON)
Real time sensing 100s of cameras Temperature Humi
dity Light spectrum/intensity Wind speed
direction Air quality (CO2, NOX..) Water levels,
quality (salts etc) Soil temp, moisture
62
http//borevitzlab.uchicago.edu
http//borevitzlab.uchicago.edu
Arabidopsis Yan Li Alex Platt Yu Huang Andy
Cal Xu Zhang Joy Bergelson Magnus Nordborg Paul
Marjoram Sabasian Zoellner
Arabidopsis Yan Li Alex Platt Yu Huang Andy
Cal Xu Zhang Joy Bergelson Magnus Nordborg Paul
Marjoram Sabasian Zoellner
Aquilegia Christos Noutsos Scott Hodges Tall
Grass Prairie Geoff Morris Paul Grabowski Mike
Miller
Aquilegia Christos Noutsos Scott Hodges Tall
Grass Prairie Geoff Morris Paul Grabowski Mike
Miller
Recommended
CrystalGraphics Presentations


