
Copy Data to Minitab - PowerPoint PPT Presentation
1 / 17
Title:
Copy Data to Minitab
Description:
Remember to paste in cell above row labeled 1 This brings column ... Chi-Square = 7.42 DF = 3 P = 0.060. Individual 95.0% CIs. Departme N = N Median Q3-Q1 ... – PowerPoint PPT presentation
Number of Views:253
Avg rating:3.0/5.0
Title: Copy Data to Minitab
1
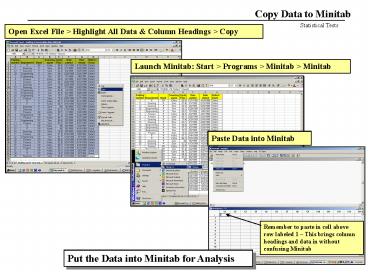
Copy Data to Minitab
Statistical Tests
Open Excel File gt Highlight All Data Column
Headings gt Copy
Launch Minitab Start gt Programs gt Minitab gt
Minitab
Paste Data into Minitab
Remember to paste in cell above row labeled 1
This brings column headings and data in without
confusing Minitab
Put the Data into Minitab for Analysis
2
Normality Test
Do you have Normal Data?
Continuous
Normal
Non Normal
Ho Data distribution Normal Distribution Ha
Data distribution ? Normal Distribution
If the p-value gt.05 Then Ho is true and there
is no difference in the groups you had me
test(Accept Ho) The Data is
normal If the p-value lt .05 ... Then Ho
is false and there is a statically significant
difference (Reject Ho ) The Data is
not Normal
m
3
Normality Test
MINITAB Statgt Basic Statisticsgt Display
Descriptive statisticsgt
Normality Testgt
If the p-value gt.05 Then Ho is true and there
is no difference in the groups you had me
test(Accept Ho) The Data is
normal If p-value lt .05 ... Then Ho is
false and there is a statically significant
difference (Reject Ho ) The Data is
not Normal
P-value 0.000 lt 0.05 Therefore The data is NOT
Normal
4
Capability
MINITAB Statgt Quality tools Capability
analysis Nonnormal
5
Visualize The Data Box Plots
Statistical Tests
Minitab Graph gt Box Plots gt YCycle Time gt X1
Department X2 Band X3 Agent
Which Xs Look they effect the Cycle Time (Mean,
Median, Variance)? If they look like they have
an impact they probably do and we can prove it
with Statistics
6
Statistical Tests
Continuous
Non Normal Data
Variance Tests Homogeneity of Variance -
Levines - Compares two or more sample
variances. Medians Tests Sign Test - Tests if a
sample median is equal to a known or target
value. Wilcoxon Test - Tests if a sample median
is equal to a known or hypothesized
value. Mann-Whitney Test - Test if two sample
medians are equal. Moods Median Test - Test if
two or more sample medians are equal. Friedman
Test - Tests if medians from samples classified
by two categories are equal. Correlation - Tests
linear relationship between two variables.
Non Normal
Variances
Medians
HOV Levines
Correlation
Moods
Wilcoxon
Mann- Whitney
Sign test
Friedman
We have these tests to choose from because the
Data is NOT NORMAL
7
Statistical Tests
Lets see what we can eliminate from our suspect
list
Staffing cycle time is exceeding 75 days 88 of
the time
Measurement Variation
Process (or product) Variation
Measurement System Valid
Time to Time
Department to Department
Job type to Job type
Band to Band
Agent To Agent
Other?
- Lets start with Department to department
- Check the variances
- Check the means
8
HOV
Statistical Tests
Staffing cycle time is exceeding 75 days 88 of
the time
Non Normal
Process (or product) Variation
Variances
HOV Levines
Department to Department
Department to Department - Variances Appropriate
Test HOV-Levines
MINITAB Statgt ANOVA Test of equal
variances
Ho Variances are the same department to
department Ha Variances are different
Response Cycle Time Factor Department
9
HOV
Statistical Tests
If the p-value gt.05 Then Ho is true and there
is no difference in variances (Accept Ho) If
the p-value lt .05 ... Then Ho is false and
there is a statically significant difference in
variances (Reject Ho ) P-value
0.000 95 Confident that the variances are
different Validates what we saw on the Box Plot
(more scatter in IT Data)
Remember Min I.Tab can only give us a
P-value, we have to determine what it means
10
Moods Median
Statistical Tests
Department to Department - Medians Appropriate
Test Moods Median
Staffing cycle time is exceeding 75 days 88 of
the time
Non Normal
Medians
Process (or product) Variation
Ho Cycle Time Medians are the same department
to department Ha Cycle Time Medians are
different Response Cycle Time Factor
Department
Correlation
Department to Department
Moods
Wilcoxon
Mann- Whitney
Sign test
Friedman
MINITAB Statgt Nonparametrics Moods
Median test
11
Moods Median
Statistical Tests
Mood Median Test Mood median test for Cycle
Ti Chi-Square 7.42 DF 3 P 0.060
Individual 95.0
CIs Departme Nlt Ngt Median Q3-Q1
---------------------------------- Engineer
3 5 84.6 5.3
(--) Finance 3 8 84.5
3.1 (-) IT
4 3 66.7 43.5
(---------------------------------) Sourcing
7 1 81.4 3.2
(-)
----------------------------------
45 60
75 Overall median 83.6
If the p-value gt.05 Then Ho is true and there
is no difference in Means (Accept Ho) If
the p-value lt .05 ... Then Ho is false and
there is a statically significant difference in
Means (Reject Ho ) P-value 0.06 The
Department Medians are NOT different at 95
Confidence Level but close
12
If our staffing cycle time data had been normal...
ANOVA
Statistical Tests
Department to Department - Means Appropriate
Test One-Way ANOVA, (Tests if more than two
sample means are equal)
Staffing cycle time is exceeding 75 days 80 of
the time
Normal
Means
Process (or product) Variation
t - test
1 - sample 2 - sample
Department to Department
ANOVA
One way Two way
Ho Cycle Time Means are the same department to
department Ha Cycle Time Means are different
Samples MUST BE NORMAL
13
Staffing Cycle Time
Statistical Tests
Lets see what we can eliminate from our suspect
list
Staffing cycle time is exceeding 75 days 88 of
the time
Measurement Variation
Process (or product) Variation
Measurement System Valid
Agent To Agent
Department to Department
Band to Band
Moods p-value 0.060 HOV p-value 0.000
Continue to work through until you find the Red X
or Xs
14
Staffing Cycle Time
Statistical Tests
Staffing cycle time is exceeding 75 days 88 of
the time
Measurement Variation
Process (or product) Variation
Measurement System Valid
Agent To Agent
Department to Department
Band To Band
Moods p-value 0.060 HOV p-value 0.000
Moods p-value 1.000 HOV p-value 0.0166
Moods p-value 0.211 HOV p-value 0.067
Department to Department is the Red X
15
Attribute Data
Statistical Tests
75 days
What if you have Attribute data?
Anything less than 75 days is Good
Anything greater than 75 days is a Defect
16
Chi 2
Statistical Tests
Staffing cycle time is exceeding 75 days 88 of
the time
Department to Department
Non-Continuous
Chi-sq
Process (or product) Variation
Correlation
Department to Department
Ho All Departments are the same Ha
Departments are different
If the p-value gt.05 Then Ho is true and there
is no difference in the groups you had me
test(Accept Ho) Departments are
the same If the p-value lt .05 ... Then Ho
is false and there is a statically significant
difference (Reject Ho ) Departments
are different
Pass Fail
Engineering Finance Sourcing
Counts of pass / fail
75 days
Anything less than 75 days is Good
Anything greater than 75 days is a Defect
17
Chi 2
Statistical Tests
Chi-Square Test Defects, Good Expected counts
are printed below observed counts Chi-Square
contributions are printed below expected counts
Defects Good Total 1 7 1
8 6.12 1.88 0.127
0.414 2 9 2 11
8.41 2.59 0.041 0.134 3 3
4 7 5.35 1.65
1.034 3.361 4 7 1 8
6.12 1.88 0.127 0.414 Total
26 8 34 Chi-Sq 5.652, DF 3, P-Value
0.130 4 cells with expected counts less than 5.
MINITAB Statgt Tables Chi Square test
If the p-value gt.05 Then Ho is true and there
is no difference in the groups you had me
test(Accept Ho) Departments are
the same If the p-value lt .05 ... Then Ho
is false and there is a statically significant
difference (Reject Ho ) Departments
are different
P-value gt .05 There is no difference between
departments
Recommended
CrystalGraphics Presentations


