
ANOVA Table - PowerPoint PPT Presentation
Title:
ANOVA Table
Description:
Title: Slide 1 Author: Derek Webb Last modified by: user Created Date: 11/26/2005 2:21:48 AM Document presentation format: On-screen Show (4:3) Company – PowerPoint PPT presentation
Number of Views:15
Avg rating:3.0/5.0
Title: ANOVA Table
1
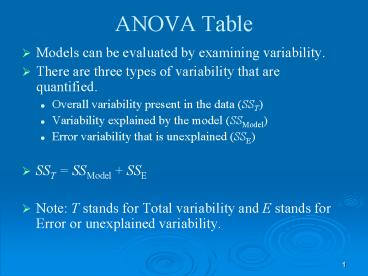
ANOVA Table
- Models can be evaluated by examining variability.
- There are three types of variability that are
quantified. - Overall variability present in the data (SST)
- Variability explained by the model (SSModel)
- Error variability that is unexplained (SSE)
- SST SSModel SSE
- Note T stands for Total variability and E stands
for Error or unexplained variability.
2
- If model variability (SSModel) is a lot larger
than error variability (SSE) then there is
evidence that the model is explanatory.
- If model variability (SSModel) is similar to
error variability (SSE) then there is no evidence
that the model is explanatory.
3
ANOVA Table
- Mean Squares (MS)
- A mean square is a sum of squares divided by the
degrees of freedom associated with that sum of
squares - Degrees of freedom of SST is N-1
- Degrees of freedom of SSModel depends on the
model and parameters that need to be estimated - Degrees of freedom of SSE is what is left
- Recall SST SSModel SSE
4
ANOVA Theory
- How important is the model?
- The larger the test statistic, the more important
the model - Test statistic follows an F distribution