
SoM presentation - PowerPoint PPT Presentation
1 / 35
Title:
SoM presentation
Description:
Professor Roland Clift Centre for Environmental Strategy University of Surrey 1. Global climate change 2. Sustainable development approach to national and ... – PowerPoint PPT presentation
Number of Views:85
Avg rating:3.0/5.0
Title: SoM presentation
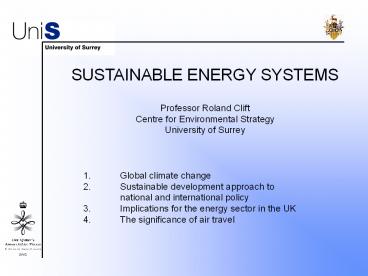
1
SUSTAINABLE ENERGY SYSTEMS
Professor Roland CliftCentre for Environmental
StrategyUniversity of Surrey
1. Global climate change2. Sustainable
development approach to national and
international policy3. Implications for the
energy sector in the UK4. The significance of
air travel
2
SUSTAINABLE DEVELOPMENT
3
RADIATION FROM SUN
4
ATMOSPHERIC CARBON DIOXIDE
Concentration of carbon dioxide in the
atmosphere Pre-industrial period 270-280
ppmv (but during glacial periods it was much
lower, down to 180 ppmw) Present value
370 ppmv and rising fast...
5
CARBON DIOXIDE CONCENTRATION AND TEMPERATURE
EVIDENCE FROM ICE CORES
6
GLOBAL CLIMATE CHANGE
- can be caused by change in absorptive
properties of the atmosphere - effect is a global temperature rise which
leads to more localised effects - climate system is non-linear and
dynamic, with positive feedbacks
therefore it is unpredictable.
7
CARBON DIOXIDE CONCENTRATION AND TEMPERATURE
EVIDENCE FROM ICE CORES
8
EVIDENCE FOR GLOBAL CLIMATE CHANGE
- Includes
- Retreat of glaciers?
- Increased frequency of El Niño events?
- Average temperatures
- Increased variability of climate
- E.g. floods in Europe one summer
- extraordinarily high temperatures the next
- (with many thousands of early deaths).
- Unusually high hurricane activity, in both
Atlantic and Pacific - Etc., etc.
9
EFFECTS OF GLOBAL CLIMATE CHANGE
- Predicted to include
- Rise in sea level
- Hence widespread flooding and displacement of
people - Cooling in some places, especially if ocean
circulation is affected - Displacement of climate zones faster than
ecosystems can adapt loss of habitat and hence
extinctions - Increased desertification and water stress
- Etc., etc
10
THE BASKET OF GASES
11
UK EMISSIONS OF GLOBAL WARMING GASES (1997)
12
ROYAL COMMISSION ON ENVIRONMENTAL POLLUTION 22ND
REPORT ENERGY - THE CHANGING CLIMATE
(2000) the world is now faced with a radical
challenge of a totally new kind which requires
an urgent response By the time the effects
of human activities on the global climate are
clear and unambiguous it would be too late to
take preventive measures. Recommended ensuring
that concentration of carbon dioxide in the
atmosphere does not exceed 550 ppmv, twice the
pre-industrial level.
13
A COMPLETELY DIFFERENT APPROACH
an effective, enduring and equitable climate
protocol will eventually require emission
quotas to be allocated to nations on a simple and
equal per capita basis nations emission
quotas (should) follow a contraction and
convergence trajectory. UK carbon dioxide
emissions must be reduced by almost 60 from
their current level by mid-century.
14
PER-CAPITA CO2 EMISSIONS, 1996
(Tonnes)
Contract Converge 3.6
15
SUSTAINABLE DEVELOPMENT
Three legs to the argument, corresponding
to the three components of sustainable
development 1. Enviro-centric limit on carbon
dioxide concentration in the atmosphere 2. Soci
o-centric the contract and converge principle
3. Techno-centric the target is
technologically and economically feasible.
16
SUSTAINABLE DEVELOPMENT
17
IS THE 60 REDUCTION FEASIBLE?
- Demand-side reductions
- e.g. improved building performance
- modal shifts in transport
- lesser improvements in manufacturing.
- - Would be encouraged by carbon levy
- Supply-side changes
- - renewable energy sources
- - electrical storage grid stability
- - carbon dioxide sequestration
- - nuclear or fossil electrical generation
- - different transport fuels and drives.
- Estimated cost of 60 reduction in UK 2 of GDP
18
UK CARBON DIOXIDE EMISSIONS FROM BURNING FOSSIL
FUELS AMOUNTED TO 22 TONNES PER HOUSEHOLD IN 1998
19
FINAL ENERGY CONSUMPTION BY SECTOR, 2001
Source DUKES Digest of UK Energy Statistics
(DTI)
20
EFFICIENCY OF ENERGY CONVERSION
- Although the first law of thermodynamics states
that energy can be neither crated nor destroyed,
different forms of energy are not simply
interchangeable. Converting heat to work involves
using some form of heat engine in which heat is
supplied at a high temperature (T1) and leaves at
a low temperature (T2). In the case of a steam
cycle, T1 corresponds to the steam temperature
entering the turbine and T2 to that of the water
formed from steam in the condenser. The maximum
fraction of the heat entering the heat engine
that can be converted to work (i.e. electrical
energy in this case) is - ?max 1 (T2/ T1) (T1 T2)/T1
- Thus ?max increases if T1 is increased. Real
generating plants have conversion efficiency
substantially below this thermodynamic limit. - The fraction of the heat not converted to work
(of electricity) leaves the engine as low-grade
heat.
21
COMBINED HEAT AND POWER (CHP) PLANT, USING STEAM
CYCLE FOR CO-GENERATION
22
TECHNICAL ISSUES
- Need to look at energy use in total, not just
electricity. - Biomass, agricultural waste, etc. need to be
used to fire CHP plants primarily for heat
output, with electrical output used to back up
intermittent renewable sources. - Needs a fundamental review of how electricity
networks can best be financed, managed and
regulated to stimulate and accommodate large
contributions to energy supplies from CHP and
renewable sources.
23
CONCLUSION
For the UK, 60 reduction in CO2 emissions by
2050 is possible. The technology is (or soon will
be) available. But is the political will
available?
24
A FURTHER RCEP REPORT
THE ENVIRONMENTAL EFFECTS OF CIVIL AIRCRAFT IN
FLIGHT November 2002
25
RCEP CONCLUSIONS 1
- The analysis in the 1999 IPCC Report is sound.
- Research since then has, if anything, revealed
even greater uncertainty. - Total contribution of aircraft to radiative
forcing is 2 to 4 times that of carbon dioxide
emissions alone. - Best estimate of the multiplier is about 3.
26
RCEP CONCLUSIONS 2
- Even the industrys own most optimistic
targets for technological advance will not
offset projected growth. - Short-haul flights (less than about 2000 km
i.e. 1000 nautical miles) are disproportionately
damaging.
27
(No Transcript)
28
EFFECT OF STAGE LENGTH ON SPECIFIC ENERGY
USAGE (Babikian, Lukachko Waitz, J.Air
Transport Management, Nov.2002)
29
SOME BROAD COMPARISONS
- In terms of contribution to radiative forcing
- Long-distance air travel is equivalent to
- 1-2 people travelling in a passenger car.
- Per passenger-km, modern high-speed
- rail travel is at least an order of magnitude
- less damaging.
- Per tonne-km, rail freight is one to two orders
- of magnitude less damaging that air freight.
- Marine freight is a factor of 2 or more less
- damaging than rail freight.
30
AIR TRANSPORT IN CONTEXT 1 Contribution to
global climate change of passenger flights
within, to and from the UK
Based on multiplier of 2.7 for aircraft
emissions Assuming low growth and significant
technological advance, with 8 to 14 reduction in
other sources. SOURCE Aviation and the
Environment using economic instruments, HM
Treasury and department for Transport, March
2003.
31
AIR TRANSPORT AND ENERGY POLICY
Following the recommendations of the Royal
Commission, the 2003 White Paper has confirmed
the policy of achieving 60 reduction in UK
carbon dioxide emissions by 2050. The projected
growth in air travel would represent more than
half the remaining 40. ??
32
RCEP CONCLUSIONS 3
- Airport capacity should not be expanded
unless/until the contribution to climate change
is brought into an effective policy. - Technological advances alone will not offset
projected growth. - Some form of demand management will be needed.
33
1. Executive summary2. Profile of the
Company - Strengths and Weaknesses - Size and
structure of company - Business areas -
Principal competitors - Companys position in
the sector(s) where it operates -
Environmental performance and reporting
The report should contain the following
components
34
The report should contain the following
components
- 3. Business Environment Opportunities
- and Threats
- Legislative environment and likely changes
- Impact of extended producer responsibility
- Product liability
- Sustainability of supply chain
- Stakeholder perceptions and social licence to
operate.
35
The report should contain the following
components
- 4. Strategic Positioning
- Recommendations on
- Product development and discontinuation
- Stakeholder engagement
- Sustainability reporting
- Etc.
Recommended
CrystalGraphics Presentations


