
Diffraction%20Lineshapes - PowerPoint PPT Presentation
Title:
Diffraction%20Lineshapes
Description:
Diffraction Lineshapes (From Transmission Electron Microscopy and Diffractometry of. Materials , B. Fultz and J. Howe, Springer-Verlag Berlin 2002. – PowerPoint PPT presentation
Number of Views:165
Avg rating:3.0/5.0
Title: Diffraction%20Lineshapes
1
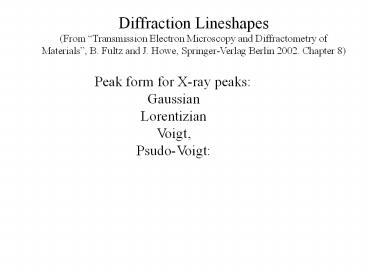
Diffraction Lineshapes (From Transmission
Electron Microscopy and Diffractometry
of Materials, B. Fultz and J. Howe,
Springer-Verlag Berlin 2002. Chapter 8)
Peak form for X-ray peaks Gaussian Lorentizian Vo
igt, Psudo-Voigt
2
Gaussian function
x0
FWHM
3
Lorentzian function or Cauchy form
x0
FWHM
4
Voigt convolution of a Lorentzian and a Gaussian
Complex error function
FWHM
most universal more complex to fit.
5
pseudo-Voigt
Gaussian function
FWHM
Lorentzian function or Cauchy form
FWHM
? Cauchy content, fraction of Cauchy form.
6
2? FWHM
7
Lineshapes disturbed by the presence of K?1 and
K?2.
Decouple them if necessary
Rachinger Correction for K?1 and K?2 separation
Assume (1) K?1 and K?2 identical lines profiles
(not necessarily symmetrical) (2) Ip of K?2 ½
Ip of K?1.
8
Example Separated by 3 unit Ii experimental
intensity at point i Ii(?1) part of Ii due to
due to K?1
General form
9
Diffraction Line Broadening and
Convolution Sources of Broadening (1)
small sizes of crystalline (2)
distributions of strains within individual
crystallites, or difference in
strains between crystallites (3) The
diffractometer (instrumental broadening)
10
Size Broadening Interference function
Define deviation vector
11
I
Half width half maximum (HWHM)
particular
usually small ?
Solve graphically
12
Define
Solution x 1.392
1.392
Define
13
FWHM
In X-ray, 2? is usually used, define
B in radians
Scherrer equation, K is Scherrer constant
If the ? is used instead of 2?, K should be
divided by 2.
14
Strain broadening Uniform strain ? lattice
constant change ? Bragg peaks shift. Assume
strain ? ? d0 change to d0(1 ?).
Diffraction condition
Peak shift
In terms of ?
Larger shift for the diffraction peaks of higher
order
15
Distribution of strains ? diffraction peaks
broadening Strain distribution ? relate to
?k
is the HWHM of the diffraction G along
16
Instrument broadening Main Sources
Combining all these broadening by the
convolution procedure ? asymmetric instrument
function
convolution
17
The Convolution Procedure instrument function
f(x) and the specimen function g(x) the observed
diffraction profile, h(?). The convolution
steps are Flip f(x)? f(-x) Shift
f(-x) with respect to g(x) by ? f(-x) ?
f(?-x) Multiply f and g f(?-x)g(x)
Integrate over x
4
f(x)
3
2
1
0
1
2
-1
-2
0
4
g(x)
3
2
1
0
1
2
-1
-2
0
Assume f and g are the functions on the right,
the h(?) that we will get is
4
f(-x)
3
2
1
0
1
2
-1
-2
0
18
? -1
? -2
4
4
0
3
3
7/6
2
2
1
1
0
0
2
-2
2
-2
0
0
? 1
? 0
4
4
3
3
31/6
16/3
2
2
1
1
0
0
2
-2
2
-2
0
0
6
5
? 2
h(?)
4
4
3
0
3
2
2
1
1
0
0
?
2
-2
0
2
-2
0
19
Convolution of Gaussians
Two functions f(?) breadth Bf g(?) breadth Bg
? h(?) f(?)g(?) breadth Bh
http//www.tina-vision.net/docs/memos/2003-003.pdf
20
Convolution of Lorentzians
Two Lorentzian functions f(?) breadth Bf
g(?) breadth Bg ? h(?) f(?)g(?) breadth Bh
21
Fourier Transform and Deconvolutions Remove
the blurring, caused by the instrument
function deconvolution (Stokes
correction). Instrument broadening function
f(k) (k is function of ?) True specimen
diffraction profile g(k) Measured by the
diffractometer h(K)
Fourier transform the above three functions (DFT)
l 1/length, the range in k of the Fourier
series is the interval l/2 to l/2.
22
The function f and g vanished outside of the k
range ? Integration from -? to ? is replaced by
l/2 to l/2
Orthogonality condition
vanishes by symmetry
23
Convolution in k-space is equivalent to a
multiplication in real space (with variable n/l).
The converse is also true. Important result of
the convolution theorem!
Deconvolution
G(n) is obtained from
24
Data from a perfect specimen
Rachinger Correction (optional)
f(k)
Corrected data free of instrument broadening
Stokes Correction G(n) H(n)/F(n)
F.T.-1
F.T.
Data from the actual specimen
Rachinger Correction (optional)
h(k)
g(k)
Perfect specimen chemical composition,
shape, density similar to the actual specimen (?
specimen roughness and transparency broadening
are similar) E.g. For polycrystalline alloy,
the specimen is usually obtained by annealing
25
f(k), g(k), and h(k) asymmetric ? F.T. complex
coeff.
26
g(k) is real and can be reconstructed as
real part
27
Simultaneous Strain and Size Broadening
True sample diffraction profile
strain broadening and size broadening effect
Usually, know one to get the other
Both unknown
Take advantage of the following
facts Crystalline size broadening is independent
of G Strain broadening depends linearly on G
28
Williamson-Hall Method Easiest way! Requires an
assumption of the shape of the peaks
Gaussian function characteristic of the strain
broadening
convolution
Kinematical crystal shape factor intensity
29
Assume a Gaussian strain distribution (quick
falloff for strain larger than the yield strain)
?(?)
30
Approximate the size broadening part with a
Gaussian function
(see page 9)
characteristic width
Good only when strain broadening gtgt size
broadening
31
The convolution of two Gaussians
Plot ?k2 vs G2
Slope
(?k)2
(HWHM)
G2
32
Approximate the size broadening and strain
broadening Lorentzian functions
Size
Strain
33
The convolution of two Lorentzian
Plot ?k vs G
Slope
?k
(HWHM)
G
34
The following pages are from http//www.imprs-am
.mpg.de/nanoschool2004/lectures-I/Lamparter.pdf
35
from P. Lamparter
Ball-milled Mo
L
G
? (FWHM)
2
36
Nanocrystalline CeO2 Powder
from P. Lamparter
37
Nb film, WH plot
from P. Lamparter
38
from P. Lamparter
39
anisotropy of shape or elastic constants,
strains. and sizes ? ?k2 vs G2 or ?k vs G not
linear Using a series of diffraction e.g. (200),
(400) (600) overlap with (442), can not be
used ? provide a characteristic size and
characteristic mean-square strain for each
crystallographic direction!
40
E?k fit better than ?k in this case ? elastic
anisotropic is the main reason for the
deviation of ?k to G.
Ball-milled bcc Fe-20Cu
41
Warren and Averbach Method Fourier Methods with
Multiple Orders
size
strain
How to interpret A(L)?
42
from P. Lamparter
43
from P. Lamparter
44
from P. Lamparter
45
from P. Lamparter
46
from P. Lamparter
47
from P. Lamparter
48
Williamson-Hall Method Easy to be done Only width
of peaks needed Warren-Averbach Method More
mathematics Precise peak shapes
needed Distributions of size and
microstrain Relation to other properties(dislocati
ons)