
IWA Poster Template - PowerPoint PPT Presentation
Title:
IWA Poster Template
Description:
Characterization of Al-Humic Complexation and Coagulation Mechanism Introduction Removal of natural organic matter (NOM) by coagulation using metal coagulants ... – PowerPoint PPT presentation
Number of Views:31
Avg rating:3.0/5.0
Title: IWA Poster Template
1
Characterization of Al-Humic Complexation and
Coagulation Mechanism
Introduction
Removal of natural organic matter (NOM) by
coagulation using metal coagulants (aluminium or
ferric salts) is a common practice in surface
water treatment. However, there are still many
things unknown regarding the interactions between
the soluble organic molecules and the metal
coagulants. In this study, the authors applied
fluorescence analysis and online optical
monitoring techniques in a series of jar-tests
for coagulation of humic acid (HA) by aluminium
sulphate (alum). Attention was mainly paid to the
characteristics of aluminium hydrolysis and
Al-humic complexation. On this basis the
mechanisms of Al-humic coagulation were also
discussed.
Results Discussion
Al-humic binding at pH 5.0 and 7.0
Mechanisms of Al-humic coagulation
Figure 1 is the fluorescence analysis result
which shows the condition of Al-humic
complexation in a raw water of HA concentration
of 10 mg/l as TOC at two typical pH values. At pH
5.0, there is almost a proportional relationship
between the dosed Al and unreacted Al, which
indicates that the dosed Al ions are reacting
with HA molecules at a constant rate. It can be
estimated that the ratio of reacted and dosed Al
is about 0.88 regardless of the dosed
concentration. At pH 7.0, there is firstly a
linear relationship with a slope of 1/1 between
the unreacted and dosed Al until a concentration
about 0.11 mM, and then there is a sudden
decrease of the unreacted Al. After the dosed Al
increases to 0.3 mM, the unreacted Al reaches an
almost constant value of 0.7-0.8 mM.
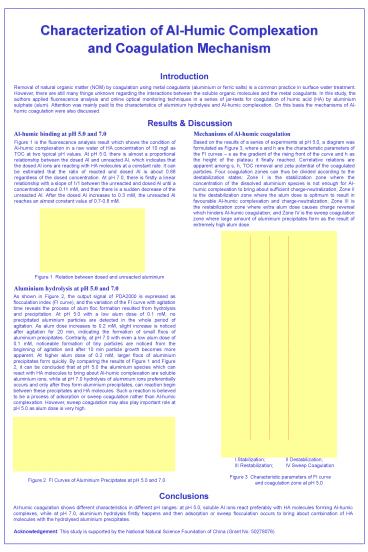
Based on the results of a series of experiments
at pH 5.0, a diagram was formulated as Figure 3,
where s and h are the characteristic parameters
of the FI curves s as the gradient of the
rising front of the curve and h as the height of
the plateau it finally reached. Correlative
relations are apparent among s, h, TOC removal
and zeta potential of the coagulated particles.
Four coagulation zones can thus be divided
according to the destabilization states Zone I
is the stabilization zone where the concentration
of the dissolved aluminium species is not enough
for Al-humic complexation to bring about
sufficient charge-neutralization Zone II is the
destabilization zone where the alum dose is
optimum to result in favourable Al-humic
complexation and charge-neutralization Zone III
is the restabilization zone where extra alum dose
causes charge reversal which hinders Al-humic
coagulation and Zone IV is the sweep coagulation
zone where large amount of aluminium precipitates
form as the result of extremely high alum dose.
Figure 1 Relation between dosed and unreacted
aluminium
Aluminium hydrolysis at pH 5.0 and 7.0
As shown in Figure 2, the output signal of
PDA2000 is expressed as flocculation index (FI
curve), and the variation of the FI curve with
agitation time reveals the process of alum floc
formation resulted from hydrolysis and
precipitation. At pH 5.0 with a low alum dose of
0.1 mM, no precipitated aluminium particles are
detected in the whole period of agitation. As
alum dose increases to 0.2 mM, slight increase is
noticed after agitation for 20 min, indicating
the formation of small flocs of aluminium
precipitates. Contrarily, at pH 7.0 with even a
low alum dose of 0.1 mM, noticeable formation of
tiny particles are noticed from the beginning of
agitation and after 10 min particle growth
becomes more apparent. At higher alum dose of 0.2
mM, larger flocs of aluminium precipitates form
quickly. By comparing the results of Figure 1 and
Figure 2, it can be concluded that at pH 5.0 the
aluminium species which can react with HA
molecules to bring about Al-humic complexation
are soluble aluminium ions, while at pH 7.0
hydrolysis of aluminium ions preferentially
occurs and only after they form aluminium
precipitates, can reaction begin between these
precipitates and HA molecules. Such a reaction is
believed to be a process of adsorption or sweep
coagulation rather than Al-humic complexation.
However, sweep coagulation may also play
important role at pH 5.0 as alum dose is very
high.
I Stabilization II
Destabilization III Restabilization IV
Sweep Coagulation
Figure 2 FI Curves of Aluminium Precipitates at
pH 5.0 and 7.0
Figure 3 Characteristic parameters of FI curve
and coagulation zone at pH 5.0
Conclusions
Al-humic coagulation shows different
characteristics in different pH ranges at pH
5.0, soluble Al ions react preferably with HA
molecules forming Al-humic complexes, while at pH
7.0, aluminium hydrolysis firstly happens and
then adsorption or sweep flocculation occurs to
bring about combination of HA molecules with the
hydrolysed aluminium precipitates.
Acknowledgement This study is supported by the
National Natural Science Foundation of China
(Grant No. 50278076)
Recommended
CrystalGraphics Presentations


