
http://mathworld.wolfram.com/Chi-SquaredDistribution.html - PowerPoint PPT Presentation
Title:
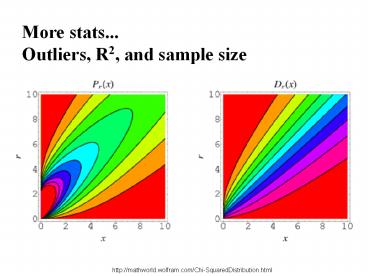
http://mathworld.wolfram.com/Chi-SquaredDistribution.html
Description:
More stats... Outliers, R2, and sample size http://mathworld.wolfram.com/Chi-SquaredDistribution.html Replicates: Technical vs Experimental Technical replicate- one ... – PowerPoint PPT presentation
Number of Views:100
Avg rating:3.0/5.0
Title: http://mathworld.wolfram.com/Chi-SquaredDistribution.html
1
More stats...Outliers, R2, and sample size
http//mathworld.wolfram.com/Chi-SquaredDistributi
on.html
2
(No Transcript)
3
- Stats practice in next lab
- Also need to start putting together your group
for inquiry 2... 3-5 people/group - Inquiry 1 written and oral reports are due in lab
Th 9/23 or M 9/27 - Homework 2 and 3 coming soon
- Online evaluation
- TA office hours calendar online
4
- In your lab notebook Write everything about
your experiments. Each entry should have a date.
Include notes (intro and conclusions), so when
you, or someone else, go back to look at your
notebook, the entries make sense.
Notebooks will be turned in as a HW later in the
semester.
5
Outliers 2, 2, 2, 2, 2, 3, 3, 3, 4, 4, 5, 5, 5,
6, 7, 121, 130 Median 4 Mean 18
6
Outliers When is data invalid?
7
Outliers When is data invalid? Not simply when
you want it to be.
8
Outliers When is data invalid? Not simply when
you want it to be. Dixons Q test can determine
if a value is statistically an outlier.
9
(No Transcript)
10
(No Transcript)
11
(No Transcript)
12
(No Transcript)
13
(No Transcript)
14
(No Transcript)
15
You need the critical values for Q table
Sample Q critical value
3 0.970
4 0.831
5 0.717
6 0.621
7 0.568
10 0.466
12 0.426
15 0.384
20 0.342
25 0.317
30 0.298
If Q calc gt Q critrejected
From E.P. King, J. Am. Statist. Assoc. 48 531
(1958)
16
You need the critical values for Q table
Sample Q critical value
3 0.970
4 0.831
5 0.717
6 0.621
7 0.568
10 0.466
12 0.426
15 0.384
20 0.342
25 0.317
30 0.298
If Q calc gt Q critthan the outlier can be
rejected Q calc 0.742 Q crit 0.717 rejection
From E.P. King, J. Am. Statist. Assoc. 48 531
(1958)
17
What can outliers tell us?
18
If you made a mistake, you should have already
accounted for that.
19
(No Transcript)
20
What about relating 2 variables?
XKCD.com
21
What about relating 2 variables? R2 gives a
measure of fit to a line. If R2 1 the data fits
perfectly to a straight line If R2 0 there is
no correlation between the data
22
R2 gives a measure of fit to a line.
birth month vs birth day
23
birth month vs birth day
24
phosphate quantity vs absorbance
25
- What about relating 2 variables?
- To use R2 the data must be continually
variable... - R2 gives a measure of fit to a line.
- If R2 1 the data fits perfectly to a straight
line - If R2 0 there is no correlation between the data
26
Samples vs populations
27
Samples vs populationsPopulation- everything or
everyone about which information is
soughtSample- a subset of a population (that is
hopefully representative of the population)
population
sample
28
- Population-
- U.S. census
- Dogs
- 1 infinity
- Sample-
- Travis county
- Poodles
- Prime numbers
29
Why use a sample instead of a population?
30
- Why use a sample instead of a population?
- Logistics
31
- Why use a sample instead of a population?
- Logistics
- Cost
32
- Why use a sample instead of a population?
- Logistics
- Cost
- Time
33
Samples Random- each member of population has an
equal chance of being part of the
sample. or Representative- ensuring that certain
parameters of your sample match the population.
34
Replicates Technical vs Experimental Technical
replicate- one treatment is divided into multiple
samples. Experimental replicate- different,
replicate, treatments are done to different
samples.
35
Testing blood sugar levels after eating a
Snickers
36
Testing blood sugar levels after eating a
Snickers Divide a participants blood into 3
samples and test blood sugar in each
sample. Technical or Experimental replicate?
37
Testing blood sugar levels after eating a
Snickers Test 3 different people. Technical or
Experimental replicate?
38
Testing blood sugar levels after eating a
Snickers Test the same person on 3 different
days. Technical or Experimental replicate?
39
What sample size do you need?
40
What sample size do you need? It depends on the
error you expect.
41
- To determine an appropriate sample size, you need
to estimate a few parameters. - Means
- Standard Deviation
- Power
- The probability that an experiment will have
a significant (positive) result, that is have a
p-value of less than the specified significance
level (usually 5).
42
This calculator will help you determine the
appropriate sample size http//www.stat.ubc.ca/r
ollin/stats/ssize/n2.html
43
What sample size do you need? It depends on the
error you expect. (So it is impossible to predict
with 100 accuracy before the experiment is
carried out.)
44
- 3rd Thursday at Blanton Art Museum(http//blanton
museum.org/calendar_events/details/third_thursday7
) - Stats practice in next lab
- Also need to start putting together your group
for inquiry 2... 3-5 people/group - Inquiry 1 written and oral reports are due in lab
Th 9/23 or M 9/27 - Homework 2 and 3 coming soon
- Online evaluation
- TA office hours calendar online
Recommended
CrystalGraphics Presentations


