
HMI Active Region Patches - PowerPoint PPT Presentation
1 / 7
Title:
HMI Active Region Patches
Description:
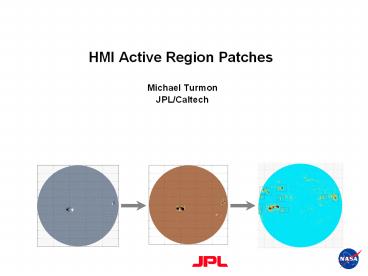
HMI Active Region Patches Michael Turmon JPL/Caltech * Mask and Patch Data Products Magnetograms (M_720s) + intensitygrams (Ic_720s) yield activity masks (Marmask_720s). – PowerPoint PPT presentation
Number of Views:55
Avg rating:3.0/5.0
Title: HMI Active Region Patches
1
HMI Active Region Patches
- Michael TurmonJPL/Caltech
2
Mask and Patch Data Products
- Magnetograms (M_720s) intensitygrams (Ic_720s)
yield activity masks (Marmask_720s). - Active clumps in Marmask_720s are grouped into
instantaneous patches (Mpatch_720s) - The instantaneous patches are linked temporally
using an overlap metric to produce HARPs (HMI AR
Patch) - A HARP is about the scale of a NOAA active
region. - We have its entire history.
Mask 2011/02/14 1200
zoom
HARP
(text overlayin this imageis flipped)
3
HARP Geometry
- HARPs are a simple concept, but their geometry
can be complex. - They are often not simply connected
- I.e., a single HARP can consist of multiple
compact blobs - Their configuration is unknown until final demise
- HARPs are retrospectively pasted together
(merged) as future growth is observed
HARPs 2011/02/14 1200
One Day Earlier
One Day Later
4
Delivering the HARPs as a Data Product
- HARPs are a sequence of cut-outs from the
original image set. - To use, you shift the cut-out to the correct
place in M_720s, etc. - There is no complex transformation. Just a shift
in pixel coordinates. - In JSOC, the HARP data series is indexed by HARP
number, analogous to NOAA AR number, and time. - Encoding on-HARP (orange patch) is 64 active
area within HARP is 66 inactive within HARP is
65. (Using symbolic KWs)
Mag 2011/02/14 1200
Instantaneous bounding box
HARP bounding box (bigger)
HARP origin
5
What the HARP is aimed at
- Why is the HARP bounding box larger than the
instantaneous bounding box? How is that size
determined? - Note You do need not to know or remember these
details. - We want the HARP to be in image coordinates for
ease-of-use, but we also want the HARP to be a
consistent size for AR studies - Key The HARP cutout is made as if seen by
observer hovering above the AR, moving at a
constant angular rate (deg. lon/day). - Per-HARP angular rate determined from
differential rotation formula in powers of
sin2(lat) evaluated at HARP centroid in latitude,
and encoded in HARP KWs. - The dimensions (degrees lon X degrees lat) of the
HARP is given by the smallest lat-lon bounding
box that encompasses all presentations of the
HARP from birth to death. - HARPs have equal extent in longitude gt they are
tall at the limb.
6
Graphical Overview of HARP Sizing
- Orange pixels are on-HARP black pixels are
active. The white line marks the instantaneous
bounding box (in image-pixel coordinates). - The blue dots mark the lat-lon center of the
HARP. The center has a constant latitude and
advances in longitude with constant rate. - The red boxes show a fixed-size lat-lon bounding
box, centered on the blue dots, which encompasses
all HARP pixels at all times. - The HARP is the smallest image-domain box
containing the red boxes.
Time ?
? Same lat/lon ?
7
Acknowledgement
- The research described in this paper was carried
out in part by the Jet Propulsion Laboratory,
California Institute of Technology, under a
contract with NASA.