
Population Dynamics and Conservation - PowerPoint PPT Presentation
1 / 21
Title:
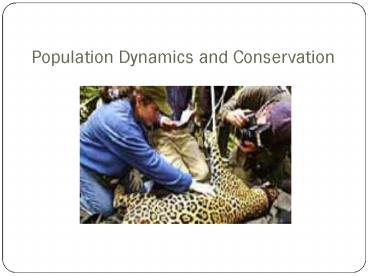
Population Dynamics and Conservation
Description:
Population Dynamics and Conservation Bringing Back the Sea Otter Keystone species: Sea otter Sea urchin Kelp beds Ode to the Sea Otters – PowerPoint PPT presentation
Number of Views:162
Avg rating:3.0/5.0
Title: Population Dynamics and Conservation
1
Population Dynamics and Conservation
2
Bringing Back the Sea Otter
- Keystone species
- Sea otter
- Sea urchin
- Kelp beds
3
Ode to the Sea Otters
- Before
- 1 million sea otters lived in the pacific
- Hunters believed to have killed all the sea
otters in the early 1900s
- After
- 1938 300 sea otters were counted
- After the U.S. Endangered species act and the
marine mammal protection act, now about 2,300 sea
otters swim the pacific
4
Population Dynamics Depend On
- Size number of individuals in a population at a
given time - Density number of individuals of a population in
a certain location at a given time - Population dispersion
- Age distribution
5
Population DispersionClumping
- Members in clusters or groups
- Food resources found in clumps
- Source of protection
- Helpful during mating season
6
Uniform Dispersion
- Individuals of the same species compete for
resources that are scarce and spread evenly. - Cresote bush release toxins that prevent seeds
from growing near it.
7
Random Dispersion
- Unpredictable pattern
- Resources and conditions are uniform in the
habitat - Rare in nature
8
Age Structure
- Prereproductive younger than sexual maturity
- Reproductive
- Postreproductive older than the maximum age of
reproduction
9
Biotic Potential Capacity for Growth
- Intrinsic rate of increase (r)
- Produce many offspring
- Exponential Growth
10
Reaching the Carrying Capacity (K)
- Lack of food/ space in the petri dish?
- S-shaped curve (logistic growth)
- Amount of light, water, space, nutrients
11
Which strategy would you use?
- Many offspring at young age
- Most offspring die before reproducing
- Generalist specie
- R-selected Species
12
And what about these organisms?
- Few offspring
- Take care of youth
- Offspring usually lives to reproduce
- Specialist
- K-selected Species
13
What limits growth?
- 4 Variables
- Births
- Deaths
- Immigration
- Emigration
14
ZERO POPULATION GROWTH
- This occurs when
- (Births Immigration) - (Deaths Emigration)
0
15
MVP
- Q When do you stop using the same resource (ie.
fish) for food? - A You stop before reaching the resources
minimum viable population (MVP) It is the min.
pop. size needed for breeding
16
Environmental Resistance
- All factors working together to limit the growth
of a population - Biotic Potential Envir. Resistance determine a
populations Carrying Capacity
17
Density Independent vs. Density Dependent
Population Control
- Density Independent
- Floods
- Hurricanes
- Earthquakes
- Landslides
- Density Dependent
- Competition
- Parasitism
- Predation
- Disease
18
How have humans modified ecosystems?
- 1. Fragmentation and degradation
- 2. Simplifying ecosystem
- 3. Strengthening some populations of pest
species and bacteria (speeding up nat. selection) - 4. Eliminating some predators
- 5. Deliberately or accidentally introducing new
species
19
- 6. Overharvesting potential renewable resources
- 7. Interfering with normal chemical cycling and
energy flow (CFCs, Ozone, etc.)
20
What do we do about it???
21
GLOBAL CPR
- C Conservation
- P Preservation
- R Restoration
- (We are the worldwe are the children)
Recommended
CrystalGraphics Presentations


