
Frequency Resp. method - PowerPoint PPT Presentation
Title:
Frequency Resp. method
Description:
Given: G(j ) as a function of is called the freq. resp. For each , G(j ) = x( ) + jy( ) is a point in the complex plane As varies from 0 to , the plot ... – PowerPoint PPT presentation
Number of Views:77
Avg rating:3.0/5.0
Title: Frequency Resp. method
1
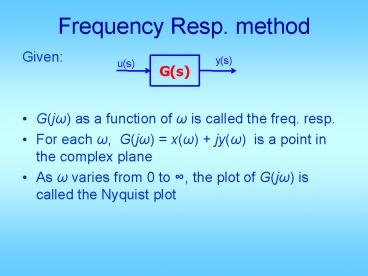
Frequency Resp. method
- Given
- G(j?) as a function of ? is called the freq.
resp. - For each ?, G(j?) x(?) jy(?) is a point in
the complex plane - As ? varies from 0 to 8, the plot of G(j?) is
called the Nyquist plot
y(s)
G(s)
u(s)
2
- Can rewrite in Polar Form
- G(j?) as a function of ? is called the
magnitude resp. - as a function of ? is called
the phase resp. - The two plots
- with log scale-?, are the Bode plot
3
Relationship between bode and nyquist
length
vector
4
- To obtain freq. Resp from G(s)
- Select
- Evaluate G(j?) at those to get
- Plot Imag(G) vs Real(G) Nyquist
- Or plot
- with log scale ? Bode
- Matlab command to explore nyquist, bode
5
- To obtain freq. resp. experimentally
- only if system is stable
- Select
- Give input to system
- Adjust A1 so that the output is not saturated or
distorted. - Measure amp B1 and phase f1 ofoutput
u(s)
y(s)
System
6
- Then is the freq. resp.
of the system at freq ?1 - Repeat the steps for all ?K
- Either plot
- or plot
7
y(s)
G2(s)
G1(s)
u(s)
Product of T.F.
G(s)
8
(No Transcript)
9
System type, steady state tracking, Bode plot
C(s)
Gp(s)
R(s)
Y(s)
10
As ? ? 0 Therefore gain plot slope 20N
dB/dec. phase plot value 90N deg
11
If Bode gain plot is flat at low freq, system is
type zero Confirmed by phase plot flat and ?
0 at low freq Then Kv 0, Ka 0 Kp
Bode gain as ??0 DC gain (convert dB to
values)
12
(No Transcript)
13
Example
14
Steady state tracking error
Suppose the closed-loop system is stable If the
input signal is a step, ess would be
If the input signal is a ramp, ess
would be If the input signal is a unit
acceleration, ess would be
15
N 1, type 1 Bode mag. plot has 20 dB/dec
slope at low freq. (??0) (straight line with
slope 20 as ??0) Bode phase plot becomes
flat at 90 when ??0 Kp DC gain ? 8 Kv K
value of asymptotic straight line evaluated at
? 1 ws0dB asymptotic straight lines 0 dB
crossing frequency Ka 0
16
(No Transcript)
17
(No Transcript)
18
Example
Asymptotic straight line
ws0dB
14
19
The matching phase plot at lowfreq. must be ?
90 type 1 Kp 8 ? position error
const. Kv value of low freq. straight line
at ? 1 23 dB 14 ? velocity error
const. Ka 0 ? acc. error const.
20
Steady state tracking error
Suppose the closed-loop system is stable If the
input signal is a step, ess would be
If the input signal is a ramp, ess
would be If the input signal is a unit
acceleration, ess would be
21
N 2, type 2 Bode gain plot has 40
dB/dec slope at low freq. Bode phase plot
becomes flat at 180 at low freq. Kp DC
gain ? 8 Kv 8 also Ka value of straight
line at ? 1 ws0dB2
22
(No Transcript)
23
(No Transcript)
24
Example
Ka
ws0dBSqrt(Ka)
How should the phase plot look like?
25
(No Transcript)
26
Steady state tracking error
Suppose the closed-loop system is stable If the
input signal is a step, ess would be
If the input signal is a ramp, ess
would be If the input signal is a unit
acceleration, ess would be
27
System type, steady state tracking, Nyquist plot
C(s)
Gp(s)
As ? ? 0
28
Type 0 system, N0
Kplims?0 G(s) G(0)K
Kp
w?0
G(jw)
29
Type 1 system, N1
Kvlims?0 sG(s) cannot be determined easily from
Nyquist plot
w?infinity
w?0
G(jw) ? -j8
30
Type 2 system, N2
Kalims?0 s2G(s) cannot be determined easily from
Nyquist plot
w?infinity
w?0
G(jw) ? -8
31
System type on Nyquist plot
32
System relative order
33
Examples
System type Relative order
System type Relative order
34
- Margins on Bode plots
- In most cases, stability of this closed-loop
- can be determined from the Bode plot of G
- Phase margin gt 0
- Gain margin gt 0
G(s)
35
(No Transcript)
36
(No Transcript)
37
If never cross 0 dB line (always
below 0 dB line), then PM 8. If
never cross 180 line (always above 180), then
GM 8. If cross 180 several
times, then there are several GMs. If
cross 0 dB several times, then there are
several PMs.
38
Example Bode plot on next page.
39
(No Transcript)
40
Example Bode plot on next page.
41
(No Transcript)
42
- Where does cross the 180
lineAnswer __________at ?pc, how much is - Closed-loop stability __________
43
(No Transcript)
44
- crosses 0 dB at __________at
this freq, - Does cross 180 line? ________
- Closed-loop stability __________
45
Margins on Nyquist plot
- Suppose
- Draw Nyquist plot G(j?) unit circle
- They intersect at point A
- Nyquist plot cross neg. real axis at k
46
(No Transcript)
47
(No Transcript)
Recommended
CrystalGraphics Presentations


