
SWBAT - PowerPoint PPT Presentation
1 / 15
Title:
SWBAT
Description:
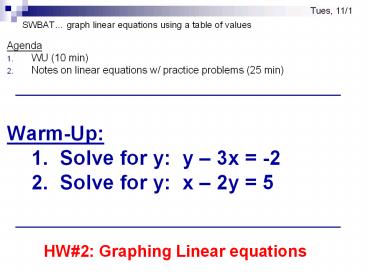
Tues, 11/1 SWBAT graph linear equations using a table of values Agenda WU (10 min) Notes on linear equations w/ practice problems (25 min) Warm-Up: – PowerPoint PPT presentation
Number of Views:56
Avg rating:3.0/5.0
Title: SWBAT
1
SWBAT graph linear equations using a table of
values
Tues, 11/1
- Agenda
- WU (10 min)
- Notes on linear equations w/ practice problems
(25 min) - Warm-Up
- 1. Solve for y y 3x -2
- 2. Solve for y x 2y 5
- HW2 Graphing Linear equations
2
Graphing linear equations using a table of values
- Infinity HS
- Ms. Sophia Papaefthimiou
3
Graphing linear equations
- To graph a linear equation you can use
- 1.) Table of values (todays lesson)
- 2.) Intercepts (next unit)
- 3.) Slope intercept form (y mx b) (next unit)
4
What is a Linear Equation?
A linear equation is an equation whose graph is a
LINE.
5
What is a Linear Equation?
The equations we will be graphing have two
variables, x and y.
For example,
A solution to the equation is any ordered pair (x
, y) that makes the equation true.
The ordered pair (3 , 2) is a solution since,
If we were to plot all these ordered pairs on a
graph, we would be graphing a line.
6
Ex 1 Graph y 3x -2 using a Table of Values
Step 1 Solve for y (write y as a
function of x)
Step 2 Make a Table of
Values
x 3x 2 y (x, y)
7
Table of Values
x 3x 2 y (x, y)
2
1
0
1
2
8
Table of Values
x 3x 2 y (x, y)
2 3(2) 2 -8 (-2, -8)
1
0
1
2
9
Table of Values
x 3x 2 y (x, y)
2 3(2) 2 -8 (-2, -8)
1 3(1) 2 -5 (-1, -5)
0 3(0) 2 -2 (0, -2)
1 3(1) 2 1 (1, 1)
2 3(2) 2 4 (2, 4)
10
y 3x 2
Step 3 Plot the ordered pairs
11
Ex 2 Graph x 2y 5
First Step Solve for y (write y as a function
of x)
x 2y 5 2y -x 5
12
Second Step Make a Table of Values
x y (x, y)
-2 -3.5 (-2, -3.5)
-1 -3 (-1, -3)
0 -2.5 (0, -2.5)
1 -2 (1, -2)
2 -1.5 (2, -1.5)
13
Graphing Horizontal Vertical Lines
When you are asked to graph a line, and there is
only ONE variable in the equation, the line will
either be vertical or horizontal.
Graph x 3
Since there are no yvalues in this equation, x
is always 3 and y can be any other real number.
y 2
Graph y 2
Since there are no xvalues in this equation, y
is always 2 and x can be any other real number.
x 3
14
SWBAT learn about high school credits, required
classes, and credits
Thurs, 12/2/10
- Agenda
- Quiz (5 min)
- Guest speaker Ms. Leary (40 min)
- Warm Up QUIZ On graph paper
- 1.) Graph 3x y 4 (Hint solve for y first)
- 2.) Graph x -6
- 3.) Graph y 1
- HW2 Graphing Linear Equations (both sides)
15
Graph x -6
Since there are no yvalues in this equation, x
is always -6 and y can be any other real number.
y 1
Graph y 1
Since there are no xvalues in this equation, y
is always 1 and x can be any other real number.
x -6
Recommended
CrystalGraphics Presentations


