
The Equilib module - PowerPoint PPT Presentation
Title:
The Equilib module
Description:
The Equilib module Regular Features Equilib calculates the conditions for multiphase, multicomponent equilibria, with a wide variety of tabular and graphical ... – PowerPoint PPT presentation
Number of Views:106
Avg rating:3.0/5.0
Title: The Equilib module
1
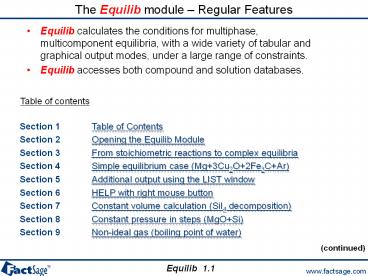
The Equilib module Regular Features
- Equilib calculates the conditions for multiphase,
multicomponent equilibria, with a wide variety of
tabular and graphical output modes, under a large
range of constraints. - Equilib accesses both compound and solution
databases.
Table of contents
Section 1 Table of Contents Section 2 Opening the
Equilib Module Section 3 From stoichiometric
reactions to complex equilibria Section 4
Simple equilibrium case (Mg3Cu2O2Fe3CAr)
Section 5 Additional output using the LIST
window Section 6 HELP with right mouse button
Section 7 Constant volume calculation (SiI4
decomposition) Section 8 Constant pressure in
steps (MgOSi) Section 9 Non-ideal gas (boiling
point of water)
(continued)
1.1
2
The Equilib module
Table of contents (continued)
Section 10 Adiabatic combustion, use of the A
parameter (CH4 O2) Section 11 Fixed activity
calculation (FeS under O2 partial
pressure) Section 12 Setting up an ideal liquid
and adding activity coefficientsA part of the
Cu-Cr System Section 13 Standard equilibrium
aqueous solutionLeaching arsenic-bearing copper
concentrate Section 14 Standard equilibrium
non-ideal solution Fe-Mn-Si-C Section 15 Adding
slag An explanation on SlagA, SlagB, Slag?
Section 16 Standard case Desulphurisation of
steel adding CaSi Section 17 Standard case
Pitzer aqueous with NaCl Section 18
Heterogeneous equilibria and the phase
rule Section 19 Compound species selection -
FactSage 6.4
1.2
3
The Equilib module
Click on Equilib in the main FactSage window.
2
4
Using Reaction and Equilib modules to identify
the most probable reaction
- What are the products of the following chemical
reaction at 25C - Mg 3 Cu2O 2 Fe3C Ar ?
- We will assume that only pure stoichiometric
compounds can be formed and we will ignore
kinetic considerations. Using the Reaction
program, we see (on the following page) there are
many possibilities. For example - 1 MgO 6 Cu 4.5 Fe 2 C 0.5 Fe3O4 Ar
- 2 MgO 6 Cu 4.667 Fe 2 C 0.667 Fe2O3
Ar - 3 MgCO3 6 Cu 6 Fe 1 C Ar
- 4 6 Cu 4.667 Fe 2 C 0.667 MgFe2O4 0.333
MgO Ar - etc
- According to the Reaction program, reaction 1 has
the most negative Gibbs energy change. Hence,
according to thermodynamic laws, this is the most
probable reaction. - By the method of Gibbs energy minimization, in a
single calculation module Equilib identifies this
most probable reaction.
3.1
5
Reaction module 4 possible isothermal isobaric
reactions and 4 values of DG
Most negative DG
DG1 -670 kJ
DG2 -659 kJ
DG3 -621 kJ
DG4 -668 kJ
3.2
6
Gibbs Energy Minimization
Where,
Equilib determines the combination of ni, Pi and
Xi which minimizes the total Gibbs energy G of
the system.
In the present example the equilibrium products
are an ideal gas and pure solid compounds
3.3
7
Reactants window entering a new reaction
Equilib has 4 windows
Reactants window
Add a New Reactant
Reactants window
Menu window
Reaction Table
List window
Results window
Open
1st entry Click on New Reaction
All calculations shown here use the FACT compound
and solution databases and are stored in
FactSage - click on File gt Directories gt
Slide Show Examples
2nd entry Define the reactants.
List of compound and solution databases
initial conditions checkbox is not selected
Press Next to go to the Menu window
4.1
8
Menu window possible products, final T and P,
and calculating the equilibrium
Menu window
Summary of the Reactants.
Save
Open
New Reaction
3rd entrySelection of compound products
ideal gas phase and pure solids.
4th entryFinal conditions 25C, 1 atm.
5th. Press to calculate equilibrium.
4.2
9
Results window FACT format output.
The equilibrium products Cu, Fe, C, MgO, Fe3O4
and Ar satisfy the mass balance and minimize the
Gibbs energy.
Results window
1 mol (39.948g) of product ideal gas at 1 atm
mainly Ar.
These are mole fractions Xi , in an ideal gas
Pi Xi Ptotal or P(CO2)eq 0.17814 x 10⁻¹⁹
atm.
Note the pure stable stoichiometric solids
activity 1.0
6 mol Cu(s1)
4.5 mol Fe(s1)
2 mol C(s1) graphite
1 mol MgO(s1)
Solids beyond this point are not formed 0 mol
and activity lt 1.0They are ordered with regard
to activity.
0.5 mol Fe3O4(s1)
4.3
10
Results window ChemSage format output
Menu bar Output gt Format gt ChemSage Format
Final conditions
Amount of reactants
Product gases gas fugacities are calculated
Product stable pure stoichiometric solids
4.4
11
List window manipulating the results
Final conditions
List window
Click on List Window
Display of gas fugacities, for examplefCO2
1.781410-20 atm. In an ideal gas, the fugacity
is equal to the partial pressure. Hence PCO2
XCO2 PT fCO2 1.7814 10-20 atm
choice of phases and
Sorry diamond is not formed adiamondlt 1
solid
GAS
format and ordered with respect to moles
5.1
12
List window distribution format
For example, Fe is distributed in a gas phase
0 as Fe(g) 2 solid phases 75 as Fe(s) and
25 as Fe3O4(s)
3. Scroll
1. Select distribution format
2. Press Refresh
5.2
13
List window thermodynamic data format
Selection 1. Show pure solid phases 2.
Format thermodynamic data
Absolute values of Gibbs energy G. DG for the
reaction 3 Fe(s) C(s) Fe3C(s) is given
by DG GFe3C - 3GFe GC
-7594.9 - 3(-8133.5) (-1711.4)
18517 J/mol
3. And press Refresh
4. To obtain the thermodynamic data format
5.3
14
Comparison of Gibbs energy values obtained by the
Reaction and the Equilib programs
Specify the phase of each reactant at 25ºC and 1
atm pressure
Thermodynamic functions DH, DG, DV, DS, DU, DA
and Prod V. The value of DG is the same as the
Reaction program (Reaction 1, page 3)
Select the initial conditions
A spontaneous isobaric isothermal chemical
reaction takes place (DGlt0) and the reaction is
exothermic DH - 693.3 kJ
5.4
15
Reactants window Help gt More information...
Menu bar Help gt More information...
Point to a frame heading or input box and then
click the mouse right button.
6.1
16
Reactants or Menu window - Help gt Directory of
examples...
Reactants or Menu window menu bar Help gt
Directory of examples...
If you want to Change Directory then go to File gt
Directory gt Select a directory or press on
View
Short description of the example
6.2
17
The mouse right button - Reactants
Click with the mouse right button
6.4
18
Help the mouse right button
Click
with the mouse right button in the enclosed
areas header or input box and information
boxes will appear.
1. Mass info 2. Mass units 3. Species info
4. Species access to ViewData 5. Phase 6.
Temperature info 7. Temperature units 8.
Pressure info 9. Pressure units 10. Stream
number info 11. Data info 12. Databases info
1
3
5
6
8
11
10
4
2
7
9
12
6.5
19
Help Example of mouse right button, Mass 1.
Header and 2. Input Box
1
Conversion of mass units
Selection of mass units
2
Default setting for masses
6.6
20
Units window T,P, Energy, Mass and Volume
Reactants Menu bar Units gt
Move the arrow through the frames to see the
conversion factors.
6.7
21
Homogeneous Gaseous Equilibria
Reacting H2S with Cl2
Products selection ideal gas solution phase
Product T 1500 K and P2 atm
Press Calculate
Drop-down menu for extensive property
6.8
22
H2S Cl2 Results window, FACT Format Output
Total pressure Ptotal 2.0 atm
Mole fraction XHCl 0.65092
Þ PHCl XHCl Ptotal 1.30184 atm
6.9
23
List window Help gt
and go to the next slide
denotes species or phase is selected as a
possible product. Other options are available.
Click right button for more
Point to a frame heading or input box, a message
box appears and then click the mouse right button
6.10
24
Help Another example of the use of the mouse
right button
1
2
3
Click mouse right button to custom select species
for gas species
Click mouse right button for extended menu on
H2S(g)
To get all the information you need about the
extended menu
6.11
25
Simple heterogeneous equilibrium thermal
decomposition of SiI4
Species selection for the thermal decomposition
of SiI4 an ideal solution gas phase and pure
solids are selected as possible products.
To view a list of the species selected before
computation and specify a pure solid Si phase
instead of 3 pure solids, click the mouse right
button at a Compound species input box or press
theList Window button
Computations are at 1400 K for two fixed
volumes 1000 and 10000 litres.
7.1
26
Custom selection of product species a short-cut
1. Click with mouse right button.
2. Select a species Click on its column or
press Ins or Del to add or remove it. For a
group of species, drag the mouse first and then
press Ins or Del.
4. A custom selection for the solid phase
3. Press OK
7.2
27
The Selection Window
7.3
28
Results window 1400 K, 1000 L for SiI4
First tab page 1/2 (selected) 0.2281 atm
Fixed volume 1000 L
Second tab 3.529E-02 atm page 2/2
7.4
29
Decomposition of SiI4 at lower vapor pressures
V 1000 L T 1400 K, P 0.22813 atm 0 mol (no
Si(s) formed) activity lt 1
V 10000 L T 1400 K, P 0.03529 atm 0.25082
mol Si(s) formed activity 1
7.5
30
Effect of Pressure on Simple Heterogeneous
Equilibria
Radiation Baffles
Pidgeon Process for the Production of
Magnesium Apparatus Schema
Ni - Cr Alloy Retort
Water-cooled vacuum connection also condenses
alkalis
Mg(Ca)O Fe - Si
Heated to 1423 K for Mg Reduction
Mg condensed on removable sleeve
Equilibrium Mg partial pressure developed at the
hot end of the retort
Final Conditionstwo different pressures and one
temperature result in 2 calculations
8.1
31
Reacting MgO with Si at 1 atm no reaction
0 mol of gas, however XMg 1.087610-3 and
Ptotal 1 atm, hence PMg eq 1.087610-3 atm
Reactants
Products
S P gas species 1.096910-3 atm
No reaction takes place because the pressure (1
atm) is too high for the gas phase
Note Unit activity but 0 mol. i.e. it is
thermodynamically ready to form.
8.2
32
MgO and Si reaction at a reduced total pressure
The gas phase is stable under a reduced total
pressure.XMg 0.99151 and Ptotal 0.001 atm,
hence PMg eq 9.9110-4 atm
Gas phase numbers are mole fractions
Compare the formation of the gas phase here at
10-3 atm with the previous page where pressure is
1 atm.
Refer to the next page for the distribution of
elements in the products.
8.3
33
Pidgeon Process for the Production of Magnesium
Results
T 1423 K Ptotal 0.001 atm
Mg(g) condenses on water-cooled removable sleeve
8.4
34
Boiling Point of Water Ideal Gas Calculation
Settings
- Products
- a liquid phase
- an ideal gas phase
Final Conditions T 0C and 150C P
1atm and any transition point in the temperature
interval
9.1
35
Boiling Point of Water Ideal Gas Calculation
Results Tb(water) 100.35C
The asterisk in front of T 100.35C indicates
the calculated value
Compare the final volume of the phase
for the equilibrium temperature between H2O(g)
ideal gas phase and H2O(L1) i.e., the ideal
boiling point
9.2
36
Boiling Point of Water Real Gas Calculation
Settings
- Products
- a liquid phase
- an real gas phase
Final Conditions T 0C and 150C P
1atm and any transition point in the temperature
interval
Possible selection of solution species (the box
Show and the radio button all are checked).
9.3
37
Boiling Point of Water, Real Gas Calculation
Results Tb 100C ChemSage Output
The asterisk in front of T 100C indicates the
calculated value
Compare the final volume of the phase
for the equilibrium temperature between H2O(g)
real gas phase and H2O(L1) i.e., the real
boiling point
9.4
38
Adiabatic Reaction between CH4 and O2
Specifying an Extensive Property, DH0
- Possible products are
- an ideal gas phase
- pure liquids and
- pure solids.
Select Initial Conditions with the checkbox.
For an adiabatic reaction, set DH0.
10.1
39
Equilibrium Products and Final T of the Adiabatic
Reaction between CH4 and O2
Product T is 3053 K. Clearly a very high
temperature. It can be used for flame
spectroscopic applications.
No condensed phases
Note DH0 DS is a maximum for specified input
conditions
10.2
40
Fixing the activity of a component in the
equilibrium state
- In the following four slides is shown how the
Equilib module can be used in order to perform
calculations which do not use an amount of a
substance but rather its chemical potential, here
the partial pressure of a gas species. - As an example FeS is considered in a gas
atmosphere with a given O2 partial pressure.
11.0
41
Fixing the Activity of a Species O2(g) in the
Product Equilibrium FeS and O2
To view a list of the species selected before
computation, press the List Window button.
Note 1.8 mol O2
1. To fix the activity of a species as O2(g),
click the mouse right button on the name of the
phase containing the species you want (in this
case, the gas phase).
Click mouse right button to custom select species
for gas species.
A right click in the compound species frame
will provide you some information
11.1
42
Fixing the Activity of a Species
2. Click the mouse right button in the first
column of the line containing O2(g) species, a
context menu opens
3. Select activity in the sub-menu
a Activity to open a dialog box
4. Fix the activity (or partial pressure) of the
speciesPress OK.
11.2
43
Activity of O2(g) in the product equilibrium FeS
and O2 Custom activity details
5. Partial pressure of O2 is fixed PO2 1
10-2 atm Press OK to return to Menu Window
6. The Custom solutions frame indicates 1
fixed activity For more information, press
Details
7. Press Calculate gtgt
11.3
44
Activity of a Species O2(g) in the Product
Equilibrium FeS and O2 Results window
0.03709 mol O2 must be added to the reactants in
order to have the final equilibrium partial
pressure for O2
i.e. FeS 1.83709 O2 as reactants
PO2 0.01 atm
Products
11.4
45
Assembling an ideal liquid and adding activity
coefficients
- In the following 16 slides is shown how in the
Equilib module two pure liquid components are
used to describe a custom defined liquid
solution. - First ideal mixing is assumed, then a comparison
with the known phase diagram is used to derive
activity coefficients via the Reaction module.
Finally the activity coefficients are applied in
complex equilibrium calculations using the
Equilib module.
12.0
46
Setting up of an ideal liquid solution of Cu and
Cr
1. In order to define the components of an ideal
liquid solution, click the mouse right button on
the name of the phase containing the species you
want (in this case, liquid).
Click mouse right button to custom select species
for liquid species.
12.1
47
Setting up of an ideal liquid solution of Cu and
Cr
12.2
48
Liquid Cu-Cr alloy assuming ideal mixing of Cu
and Cr
6. Press OK to return to the Menu Window where
the Custom Solutions label box indicates 1
ideal solution For more information, press
Details
5. Cr(liq) and Cu(liq) are the components of
Ideal Solution 1
7. Set Final Conditions and press Calculate gtgt
12.3
49
Results window assumption of Cr(liq) - Cu(liq)
ideal mixing.
ChemSage format
Ideal solution phase liquid1 Numbers are mole
fractionsXCr(liq) 0.4XCu(liq) 0.6
FACT format
12.4
50
List window assumption of Cr(liq) - Cu(liq)
ideal mixing
Ideal solution, henceXCu(liq) aCu(liq)
0.6XCr(liq) aCr(liq) 0.4
- List Window
- check Show, Species selected
- select
- Format mole and Order code.
Option Show properties checked
According to the phase diagram (next
page) XCr(liq) 0.01837 at 1373.15 K
(1100C). Hence, the assumption of an ideal
solution is not very good in this example.
12.5
51
Tie-lines in the Cu-Cr phase diagram
12.6
52
Input to program Reaction to calculate activity
of Cr liquid in equilibrium with solid Cr
Pure Cr(s)aCr(solid) 1(from phase diagram)
Cr(liq) in solutionaCr(liquid) X
Isothermal reaction, hence equilibrium when DG
0.
Output of interest Activity of the liquid phase
12.7
53
Estimation of the Henrian activity coefficient of
Cr(liq) in Cu(liq)
12.8
54
Modifying the Custom Solution Selection
1. A custom solution selection of the liquid
phase species exists. In order to modify it,
click the mouse right button on liquid phase.
12.9
55
Specifying the temperature dependant Henrian
activity coefficient for Cr in Cu(liq)
12.10
56
View of the Selection Window and use of the Show
feature
12.11
57
View of the Selection Window Help (detailed
information)
12.12
58
Setting the Final Conditions for the Cr-Cu
Calculation
- 5. Return to Menu WindowThe Custom Solutions
label box indicates - 1 activity coefficient
- 1 ideal solution
- For more informations, press Details
6. Set Final Conditions and press Calculategtgt
12.13
59
Results for oxidation of Cu-Cr alloy at 1100 C.
Liquid alloy coexists with solid Cr the
composition agrees with the phase diagram.
0 mol i.e. no gas phase. However, these mole
fractions give equilibrium partial pressures.
For example Pcu 0.76848 10-6 atm.
Flag to a custom solution
XCr(l) 0.01839 same value as phase diagram
Pure solid Cr
12.14
60
More Results for Cu - Cr Alloy T 1200 C and
1300 C
1200 C
XCr(l) 0.041963, same value as phase diagram.
Pure solid Cr
1300 C
XCr(l) 0.086158, same value as phase diagram.
Pure solid Cr
12.15
61
List Window a Summary of Activities of Cr and
Cu in Liquid Alloy
Compare Cr concentration in liquid alloy with
liquidus in the binary phase diagram Cu - Cr (see
earlier slide 12.6).
12.16
62
Standard equilibrium with ideal aqueous solution
- In the following four slides is shown how use is
made of the ideal aqueous solution data for
elevated temperatures and pressures. - The leaching of an arsenic-bearing copper
concentrate is used as an example.
13.0
63
Leaching of an arsenic-bearing copper concentrate.
Arsenic-bearing copper concentrate
Leaching agent
- Two ideal solutions
- gas and aqueous
- and pure solids.
Elevated T and P
13.1
64
Results Window FACT output for the leaching of an
copper concentrate
The ideal gas phase species
The reactants
XH2O 0.80267 Ptotal 5.0 atm PH2OXH2OPtotal
4.01335 atm
13.2
65
Results Window FACT output for the leaching of an
copper concentrate
The aqueous phase species
Important in aqueous solutions the solutes are
given with respect to 55.5 mol(1000 g or 1L) of
water. Hence, the values are molalities. For
example mH 0.49922 hence pH -log10
(0.49922) 0.302
Note the potential with respect to the standard
H2(g) electrode.
13.3
66
Results Window FACT output for the leaching of an
copper concentrate
The solid phase species
Three pure solids at equilibrium with the aqueous
and gas solutions.
13.4
67
Standard equilibrium with dilute solution phase
- The following two slides show the use of a dilute
metallic liquid phase from the FTdemo database,
here Fe-liq, in the Equilib module.
14.0
68
Selection of FTdemo Non-Ideal Solutions
FTdemo-FeLQ. The Menu Window Interface.
full title name short description of the
complete solution phase list of possible
components for the current system
A click in the Fe-liq cell gives (note that all
this info appears in the Custom Select Species
window)
Fe-liq steel using MO associate model of In-Ho
Jung, with solutes Ag, Al, B, C, Ca, Ce, Co Cr,
Cu, H, Hf, La, Mn, Mo, Mo, N, Nb, Nd, Ni, O, P,
Pb, Pd, S, Si, Sn, Ta, Th, Ti, U, V, W and Zr
Click mouse right button for extended menu on
FACT-FeLQ.
denotes custom selection not all the
species have been selected.
Click mouse right button to custom select species
for FACT-FeLQ.
14.1
69
Results Window FACT format output solubility of
C in liquid cast iron
Compositions in the liquid solution phase Fe-liq
are given in weight percent (wt. ).
- The amount of
- Fe is 100.00 g
- 93.332 107.14 g
- Mn is 1.00 g
- 0.93332 107.14 g
- Si is 1.00 g
- 0.93332 107.14 g
- C is 5.1440 g
- 4.8011 107.14 g
Compositions of the solution in mole and mass
fraction
Graphite saturation
14.2
70
Adding a slag to the Fe-Mn-Si-C system
- The following six slides are devoted to a special
case in the FTdemo database The use of a slag
phase when several options concerning the
composition of the slag ( SlagA, SlagB, Slag? )
are available. - Here the FTdemo database (called FACT in some of
the slides) is used for purposes of teaching.
Since the results can be imprecise and even
totally wrong you must never publish results that
employ FTdemo data. - For research and publications use the protected
public databases that are regularly updated
FactPS, FToxid etc.
15.0
71
FTdemo Non-Ideal Solutions Listing the
available solution datasets.
There are 20 solution datasets available for this
mix of reactants in the FTdemo Solution database
To see the list of Solution species Check
Show and select all Then scroll through the
list.
15.1
72
More information about the available slag and
liquid iron solution phases.
15.2
73
Selection of the solution phases for the
decarburisation of pig iron by oxygen injection
15.3
74
FACT Non-Ideal Solutions warning about the
modification of a solution phase.
15.4
75
Decarburisation of pig-iron by oxygen injection
(Results window, FACT format)
Reactants, ltAgt 5
Almost 100 CO(g)
- Less C in liquid steel because C has mostly gone
into the gas phase. - Less Si in liquid steel because of its oxidation
into the slag.
CaO addition promotes slag formation.
No solid phases
15.5
76
Decarburisation of pig-iron by oxygen injection
(Results window, ChemSage format)
15.6
77
A standard case with slag-metal input plus
additives
- The following six slides show how the Equilib
module is applied to a steel metallurgical
question involving a liquid Fe-based solution, a
slag phase, a gas phase based on argon and the
addition of CaSi to treat the sulfur content of
the Fe-liquid phase.
16.0
78
Desulfurizing a steel by CaSi addition.
Reactants entry.
16.1
79
initial conditions Default Values and Stream
Features
16.2
80
Desulfurizing a steel by CaSi addition, selection
of solution phases and final conditions
Summary of the Reactants window
Solution species selected
- Final conditions
- ltAgt 0.015
- T 1627C
- P 1 atm
- and Calculate gtgt
16.3
81
Desulfurizing a Steel by CaSi Addition. FACT
Format Results.
Gas phase, mainly Ar
- Two liquid solutions
- liquid steel
- slag containing sulfur
No solid phases (activitylt1)
16.4
82
Desulfurizing a Steel by CaSi Addition. ChemSage
Format Results (4 parts)
2
1
Final Conditions
STREAM CONSTITUENTS or AMOUNT of reactants
Product solution slag (SLAGA or Aslag-liquid)
phase
Product gas phase, mainly Ar
Product solution steel (FELQ or Fe-liq) phase
16.5
83
Desulfurizing a Steel by CaSi Addition. ChemSage
Format Results (4 parts)
4
3
Mass fractions of system components
No pure solid phases
Equilibrium thermodynamic values
16.6
84
A standard case with aqueous solutions
- The following slides show how Equilib is used for
calculations of equilibria in which a non-ideal
aqueous phase is involved. - The aqueous phase is described by the Pitzer
model which permits high concentrations of
dissolved aqueous species to be treated. - In addition to listing the calculated aqueous
concentrations, the results include the aqueous
properties pH, Eh/V, Total solute molality,
Ionic strength, Osmotic coefficient and
Debye-Hueckel slope.
17.0
85
Non-Ideal Aqueous Solutions FACT-PITZ (Pitzer)
Mixing 10 mol of NaCl and 1 mol of water at 25C
and 1 atm creates brine saturated in NaCl.
17.1
86
Solubility of NaCl in water FACT format output
Aqueous phase results with respect to 55.508 mol
H2O (i.e. 1 Kg H2O) hence in molalities.
mH 5.4059 x 10⁻⁸
Output gt Format gt FACT Format
Here the solubility of NaCl in water at 25C is
mNaCl 6.1338 mol/kg H2O
-log10 (aH) 6.597
17.2
87
Solubility of NaCl in water ChemSage format
output
Output gt Format gt ChemSage Format
pH -log10 (aH) -log10(2.5287 x 10⁻⁷)
6.5971
Summary of aqueous properties
Equilib
17.3
88
Heterogeneous equilibria and the phase rule
- The following five slides show how the
heterogeneous phase equilibria calculated using
Equilib are subject to the Phase Rule. - For a series of calculations with fixed
temperature and pressure and variable composition
it is shown how many degrees of freedom are left
for the various equilibrium states calculated.
18.0
89
Simple Heterogeneous Equilibria and the Phase
Rule
Oxidation of iron sulfide by a variable amount
(ltAgt) of oxygen
A multiple entry for the variable quantity
ltAlphagt ltAlphagtfirst 0.6 ltAlphagtlast 0.65
and step 0.01
6 calculations will be performed for ltAgt from
0.60 to 0.65 in increments of 0.01 (0.60, 0.61,
0.62, , 0.65).
18.1
90
FeS Oxidation and Results when ltAgt 0.60 mol
(FACT Format)
T1000 K, ltAgt 0.60 mol
- Products
- ideal gas phase solution mainly SO2
- 1st solid phase Fe3O4(s2)
- 2nd solid phase FeS (s3)
18.2
91
FeS Oxidation and Results when ltAgt 0.61 mol
(FACT Format)
Note Same phases and gas partial pressure as for
ltAgt 0.60 mol but different amounts. This is
explained by the Phase Rule FCP2where
C3 and P3, hence F2 (T and P). At 1000 K and 1
atm, the system is invariant.
T1000 K, ltAgt 0.61 mol
- Products
- ideal gas phase solution mainly SO2
- 1st solid phase Fe3O4(s2)
- 2nd solid phase FeS (s3)
18.3
92
FeS Oxidation and Results when ltAgt 0.62 mol
(FACT Format)
T1000 K, ltAgt 0.62 mol
- Products
- ideal gas phase solution mainly SO2
- a solid phase Fe3O4(s2)
Note All FeS(s3) is oxidized Now only 2 phases
(P 2) exist.From Phase Rule F 3 and gas
phase composition varies in equilibrium with
Fe3O4 (s2), the system is univariant.
18.4
93
FeS Oxidation and Results when ltAgt 0.65 mol
(FACT Format)
T1000 K, ltAgt 0.65 mol
- Products
- ideal gas phase solution mainly a mixture of
SO2 and SO3
Note Oxidation is complete. Fe2O3(S1) is the
stable product.
18.5
94
Compound species selection - FactSage 6.4
In FactSage 6.4 there is a new default exclusion
of species from compound species selection When
two or more databases are connected, the same
species may appear in more than one database. In
such cases, a species should generally only be
selected from one database. Otherwise conflicts
will probably occur. In order to assist users in
deciding which species to exclude, the FactSage
developers have assigned priorities. When you
initially click on "pure solids", "pure liquids",
or "gas" you may now see that several species
marked with an "X" have not been selected. That
is, they have been excluded by default because of
probable conflicts between databases. The
FactSage developers suggest that these species
not be selected for this particular
calculation. If you wish to select species
marked with an "X" you must first click on
'permit selection of "X" species'. This will then
override the default setting and permit you to
select species as in FactSage 6.3. This will also
activate the 'suppress duplicates' button and
enable you to define a database priority list as
in FactSage 6.3. IMPORTANT For many
calculations, it may frequently be advisable or
necessary to de-select other species in addition
to those marked with an "X."
19.0
95
Compound species selection - FactSage 6.4
CaO SiO2 using FactPS and FToxid databases.
Right-click on pure solids to open the
Selection Window
The species marked with an "X" have not been
selected. The FactSage developers suggest that
these species not be selected for this particular
calculation.
19.1
96
Compound species selection - FactSage 6.4
To override the default setting and select
species marked with an "X, click on 'permit
selection of "X species'.
You can then also set a database priority list
and Suppress Duplicates.
19.2
Recommended
CrystalGraphics Presentations


