
Analysis%20of%20Covariance - PowerPoint PPT Presentation
Title:
Analysis%20of%20Covariance
Description:
Analysis of Covariance Combines linear regression and ANOVA Can be used to compare g treatments, after controlling for quantitative factor believed to be related to ... – PowerPoint PPT presentation
Number of Views:147
Avg rating:3.0/5.0
Title: Analysis%20of%20Covariance
1
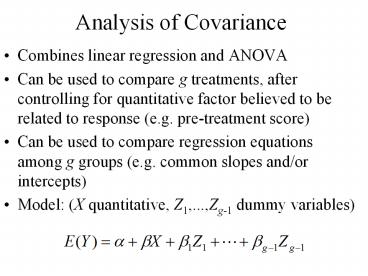
Analysis of Covariance
- Combines linear regression and ANOVA
- Can be used to compare g treatments, after
controlling for quantitative factor believed to
be related to response (e.g. pre-treatment score) - Can be used to compare regression equations among
g groups (e.g. common slopes and/or intercepts) - Model (X quantitative, Z1,...,Zg-1 dummy
variables)
2
Tests for Additive Model
- Relation for group i (i1,...,g-1) E(Y)abXbi
- Relation for group g E(Y)abX
- H0 b1...bg-10 (Controlling for covariate, no
differences among treatments)
3
Interaction Model
- Regression slopes between Y and X are allowed to
vary among groups
- Group i (i1,...,g-1) E(Y)abXbigiX(a
bi)(b gi)X - Group g E(Y)abX
- No interaction means common slopes g1...gg-10
4
Inference in ANCOVA
- Model
- Construct 3 sets of independent variables
- X , Z1,Z2,...,Zg-1, XZ1,...,XZg-1
- Fit Complete model, containing all 3 sets.
- Obtain SSEC (or, equivalently RC2) and dfC
- Fit Reduced, model containing X ,
Z1,Z2,...,Zg-1 - Obtain SSER (or, equivalently RR2) and dfR
- H0g1...gg-10 (No interaction). Test Statistic
5
Inference in ANCOVA
- Test for Group Differences, controlling for
covariate - Fit Complete, model containing X ,
Z1,Z2,...,Zg-1 - Obtain SSEC (or, equivalently RC2) and dfC
- Fit Reduced, model containing X
- Obtain SSER (or, equivalently RR2) and dfR
- H0 b1...bg-10 (No group differences) Test
Statistic
6
Inference in ANCOVA
- Test for Effect of Covariate controlling for
qualitative variable - H0b0 (No covariate effect) Test Statistic
7
Adjusted Means
- Goal Compare the g group means, after
controlling for the covariate - Unadjusted Means
- Adjusted Means Obtained by
evaluating regression equation at - Comparing adjusted means (based on regression
equation)
8
Multiple Comparisons of Adjusted Means
- Comparisons of each group with group g
- Comparisons among the other g-1 groups
- Variances and covariances are obtained from
computer software packages (SPSS, SAS)
Recommended
CrystalGraphics Presentations


