
2.6: Linear Inequalities in Two Variables - PowerPoint PPT Presentation
1 / 8
Title:
2.6: Linear Inequalities in Two Variables
Description:
2.6: Linear Inequalities in Two Variables A linear inequality forms a line that is shaded on one side. There are four types: Ax + By C – PowerPoint PPT presentation
Number of Views:206
Avg rating:3.0/5.0
Title: 2.6: Linear Inequalities in Two Variables
1
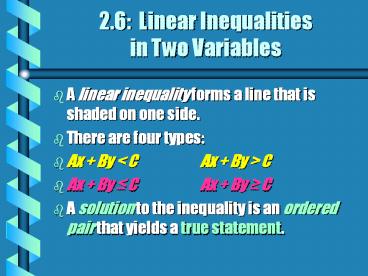
2.6 Linear Inequalities in Two Variables
- A linear inequality forms a line that is shaded
on one side. - There are four types
- Ax By lt C Ax By gt C
- Ax By C Ax By C
- A solution to the inequality is an ordered pair
that yields a true statement.
2
Graphing a Basic Linear Inequality
- Step 1 Graph the boundary line of the
inequality. Use a dashed line for lt or gt a
solid line for or . - Step 2 To decide which side to shade, test a
point not on the boundary line. - If a TRUE statement happens, then shade on the
SAME side of the line. - If a FALSE statement happens, then shade on the
OPPOSITE side of the line.
3
Examples
- Graph y lt -2
- Notice that the line is dashed because of the lt
4
Examples
- Graph x 1
- Notice that the line is solid because of the
5
More Sophisticated Examples
- Graph y lt 2x
- m 2 b 0
- Dashed
- Test (0, 3)
- Is 3lt2(0) ?
- FALSE
6
More Sophisticated Examples
- Graph 2x - 5y 10
- x-int 5
- y-int -2
- Test (0,0)
- 2(0) - 5(0) 10
- Is 0 10 ? FALSE!
7
Challenge Extended!
- Graph 4x 2y 8
8
Challenge Extended
- Graph y lt -3x 1