
1.9 Graphing Data on the Coordinate Plane - PowerPoint PPT Presentation
1 / 10
Title:
1.9 Graphing Data on the Coordinate Plane
Description:
1.9 Graphing Data on the Coordinate Plane Two number lines that intersect at right angles form a coordinate plane. X- axis the horizontal axis – PowerPoint PPT presentation
Number of Views:155
Avg rating:3.0/5.0
Title: 1.9 Graphing Data on the Coordinate Plane
1
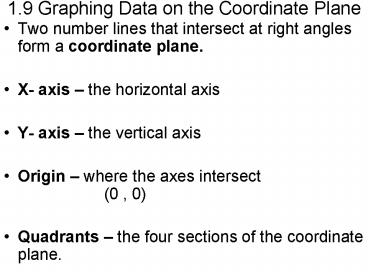
1.9 Graphing Data on the Coordinate Plane
- Two number lines that intersect at right angles
form a coordinate plane. - X- axis the horizontal axis
- Y- axis the vertical axis
- Origin where the axes intersect
(0 , 0) - Quadrants the four sections of the coordinate
plane.
2
Coordinate Plane
y - axis
( , )
( - , )
Origin (0 , 0)
x - axis
( - , -)
( , -)
3
Graphing Points
- An ordered pair of numbers identifies the
location of a point. - These numbers are the coordinates of the point on
the graph. - (x-coordinate, y-coordinate)
- (-2 , 4)
4
Identifying Coordinates
Q
P
W
V
O
Z
T
5
Identifying CoordinatesName the coordinates of
each point on the graph.
- Point O
- Point P
- Point Q
- Point T
- Point V
- Point W
- Point Z
- (0 , 0) - origin
- (-4, 1)
- (0 , 2)
- (3 , -3)
- (-1 , 1)
- (4 , 1)
- (-2 , -3)
6
Graphing Points
- Graph the point A (3 , -4) on the coordinate
plane.
A
7
Identifying Quadrants
- In which quadrant or on which axis would you find
each point. - (-1 , 5)
- Since the x-coordinate is negative, and the
y-coordinate is positive, the point is in
Quadrant II. - b. (0 , 3)
- Since the x-coordinate is 0, the point is on
the y-axis.
8
1.9 Graphing Data on the Coordinate Plane (Cont.)
- 9/29/10
- A scatter plot a graph that relates two groups
of data. - Most scatter plots are in the first quadrant of a
coordinate plane, because the data are usually
positive numbers.
9
Scatter Plot
Year Number of Households With Television (millions)
1950 4
1960 46
1970 59
1980 76
1990 92
2000 101
10
Scatter Plots
- Positive correlation in general, both sets of
data increase together. - Negative correlation in general, one set of
data decreases as the other set increases. - No correlation sometimes data sets are not
related. - Trend line shows a correlation more clearly
Negative Correlation
No Correlation
Positive Correlation
Recommended
CrystalGraphics Presentations


