
Perfusion Chamber Design for Cell Membrane Permeability Measurement in 3D Tissues - PowerPoint PPT Presentation
1 / 1
Title:
Perfusion Chamber Design for Cell Membrane Permeability Measurement in 3D Tissues
Description:
B A Perfusion Chamber Design for Cell Membrane Permeability Measurement in 3D Tissues point of focus 3D specimen objective laser dichroic mirror pinholes – PowerPoint PPT presentation
Number of Views:40
Avg rating:3.0/5.0
Title: Perfusion Chamber Design for Cell Membrane Permeability Measurement in 3D Tissues
1
Perfusion Chamber Design for Cell Membrane
Permeability Measurement in 3D Tissues
Methods
Introduction
Design Specifications
Heat Exchanger
Cryopreservation Preserves cells and tissues at
sub-zero temperatures so that they can later
be restored to their initial biological state.
Cell damage due to intercellular ice formation
and osmotic pressure differences is minimized .
Metrics and Goals
Energy Balance Assumptions
- Steady state - Constant source and sink - No
radial profile - Thermal resistance of
perfusion tubing is minimal
Thermal range 4 37 C Thermal
stability 0.2C
Fluid lag time 0 sec Tissue
mobility 0 mm/sec
Allowable flow rates 0 200 mL/h Changeable
fluid dual inputs
Figure 2. Pseudo-islets aggregates of pancreatic
MIN6 mouse insulinoma beta cells could
be used to cure diabetes. Human cell
cryopreservation would allow for cell storage
from multiple donors until implantation.
Experiment Design
Chamber Control
Tissue Viability
Figure 1. Cell volume changes due to hyposmotic,
hyperosmotic, and isosmotic solutions.
- Confocal Microscopy
- Base and top plates are dimensioned to fit on
the microscope stage. - Non-Fluorescent Materials
- A glass cover slip fits over a hole in the base
plate, so that the fluorescent light will only
hit the glass and tissue sample. - Perfusion Flow Rate Range
- Fluid is pushed into the chamber by an
adjustable syringe pump. - Thermal Range
- Perfusion fluid is heated/cooled to temperature
by a circulating water bath in the heat
exchanger.
- Minimize Dead Space
- Swagelok connectors allow controlled depth of
the perfusion tubing in the chamber. - Perfusion Fluid Change
- A Y-connector is placed adjacent to the inlet
Swagelok connector. - Thermal Stability
- 1 meter of perfusion tubing is wrapped in the
temperature-controlled water bath.
- Minimal Tissue Manipulation
- Rubber bands wrap around the top and base plates
and allow for quick assembly. - Secured Tissue
- The tissue sample is stabilized with a mesh,
which is secured by a rubber gasket. - Low Shear Rates
- The mesh reduces shear rate, while the depth of
the perfusion tubing can be adjusted for further
alterations.
Given TW 4 C, TPin 23.4 C , V200
mL/h L 0.77 m when TPout TW 4 C
Issue Statement Cryopreservation of 3D tissue
still remains a challenge. Cell membrane
permeability is an important component in
cryopreservation procedure optimization.
Laminar flow through a pipe
Hypotonic Conditions
Minimize Dead Space
A
B
Hypertonic Conditions
Project Statement Design, fabricate, and assess
a 3D tissue perfusion chamber to measure cell
membrane permeability using fluorescent confocal
microscopy.
Figure 3. Permeability can be indirectly measured
by the linear relationship between fluorescence
intensity and relative cell volume change.
Figure 4. Inverted confocal microscopy (A)
Fluorescent specimen is illuminated with
a point of light. (B) Emitted
fluorescent light reaches detector.
Figure 5. (A) Minimizing dead space immediately
over the tissue is important to ensure that the
tissue contacts the perfusion fluid.
(B) Otherwise, the fluid concentration
contacting the tissue is unknown.
Results
Conclusions
Chamber Design
Chamber Assessment
- The preliminary design and chamber assessment
suggest that this assembly has the potential to
measure cell permeability of 3D tissues using
fluorescent confocal microscopy. - Chamber assembly fits with the confocal
microscope and is leak proof during perfusion - Heat exchanger shell temperature stays constant
due to a fast water flow rate and thorough mixing - Perfusion fluid reaches water bath temperature
using 1 m of tubing - Samples are sufficiently stabilized with a 20 µm
pore mesh that is secured quickly with rubber
gaskets - Chamber clearance can be controlled with exit
perfusion tubing height
Heat Exchanger (HX) Performance
Chamber Clearance
A
Figure 7. The temperature of the perfusion
fluid exiting the chamber was monitored
with thermocouples during perfusion flow rates
of 50, 100, 150, and 200 mL/h and HX shell
temperatures of (A) 37, (B) 30, (C) 15, and (D) 4
C. The figure shows that the perfusion fluid,
initially at RT, reached each shell temperature
at different flow rates within 1 m of perfusion
tubing.
- Incoming fluid pressurizes the airtight chamber
so that the chamber fluid level is only as high
as the exit perfusion port - Perfusing at 200 ml/h with perfusion tubes
placed 2 mm above the coverslip surface, takes a
minimum of 6.7 sec to completely flush the
chamber.
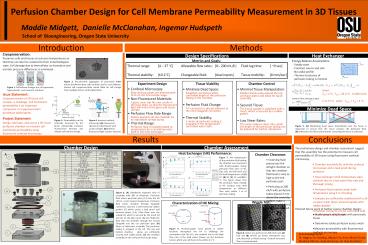
Figure 6. (A) SolidWorks exploded view of
assembly with Bill of Materials. Perfusion fluid
enters perfusion ports (14) into the HX (10) to
reach desired temperature. Perfusion fluid enters
chamber through Swagelok connectors (12) into a
well created by rubber gaskets (5) which create a
leak proof seal between plates (1,6). Fluid flows
over the sample (3) which is secured by the mesh
(4) and sits on the glass cover slip (2). Finally
the fluid exits the chamber through the second
Swagelok and the out perfusion port. (B) Photo of
fabricated assembly. The perfusion tubing is
wrapped in the HX. The top and bottom chamber
plates are sufficiently secured with rubber
bands. (C) The chamber assembly on the confocal
microscope stage.
Wiggle Test
Characterization of HX Mixing
- Planned future work to further assess chamber
design - Verify sample stabilization with pancreatic
tissue - Determine solute perfusion across mesh
- Measure permeability with fluorescence confocal
microscopy
Figure 9. Thermocouples were placed at twelve
locations throughout the HX to challenge the
assumption that the ?TW was minimal due to the
high flow rate of the shell water. Shown are the
locations tested, which were all found to be
within 0.1 C.
- Acknowledgements
- Dr. Higgins, Dr. Harding, Allyson Fry, Anne-Marie
Girard, - Manfred Dittrich, Andy Brickman, Dr. Skip
Rochefort
Figure 8. Water was perfused at 200 mL/h over (A)
hair and (B) 90-150 µm beads. Movement was only
observed at initial startup. Gradual increased
flow is recommended.
Recommended
CrystalGraphics Presentations


