
Report Writing Cost Savings Per Report - PowerPoint PPT Presentation
1 / 3
Title:
Report Writing Cost Savings Per Report
Description:
Report Writing Cost Savings Per Report 1 Analyte 4 Analytes Method Validation (hours) Sample Analysis (hours) Method Validation (hours) Sample Analysis (hours) – PowerPoint PPT presentation
Number of Views:74
Avg rating:3.0/5.0
Title: Report Writing Cost Savings Per Report
1
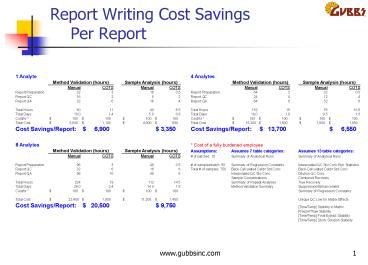
Report Writing Cost Savings Per Report
1 Analyte 4 Analytes
Method Validation (hours) Method Validation (hours) Sample Analysis (hours) Sample Analysis (hours) Method Validation (hours) Method Validation (hours) Sample Analysis (hours) Sample Analysis (hours)
Manual COTS Manual COTS Manual COTS Manual COTS
Report Preparation 32 3 16 0.5 Report Preparation 64 3 32 0.5
Report QC 16 2 8 2 Report QC 24 4 12 4
Report QA 32 6 16 4 Report QA 64 8 32 6
Total Hours 80 11 40 6.5 Total Hours 152 15 76 10.5
Total Days 10.0 1.4 5.0 0.8 Total Days 19.0 1.9 9.5 1.3
Cost/hr 100 100 100 100 Cost/hr 100 100 100 100
Total Cost 8,000 1,100 4,000 650 Total Cost 15,200 1,500 7,600 1,050
Cost Savings/Report Cost Savings/Report 6,900 3,350 Cost Savings/Report Cost Savings/Report 13,700 6,550
8 Analytes Cost of a fully burdened employee Cost of a fully burdened employee Cost of a fully burdened employee
Method Validation (hours) Method Validation (hours) Sample Analysis (hours) Sample Analysis (hours) Assumptions Assumes 7 table categories Assumes 7 table categories Assumes 13 table categories Assumes 13 table categories
Manual COTS Manual COTS of batches 15 Summary of Analytical Runs Summary of Analytical Runs Summary of Analytical Runs Summary of Analytical Runs
Report Preparation 96 3 48 0.5 of samples/batch 50 Summary of Regression Constants Summary of Regression Constants Interpolated QC Std Conc Run Statistics Interpolated QC Std Conc Run Statistics
Report QC 32 6 16 6 Total of samples 750 Back-Calculated Calibr Std Conc Back-Calculated Calibr Std Conc Back-Calculated Calibr Std Conc Back-Calculated Calibr Std Conc
Report QA 96 10 48 8 Interpolated QC Std Conc Interpolated QC Std Conc Dilution QC Conc
Sample Concentrations Sample Concentrations Combined Recovery Combined Recovery
Total Hours 224 19 112 14.5 Summary of Repeat Analyses Summary of Repeat Analyses True Recovery
Total Days 28.0 2.4 14.0 1.8 Method Validation Summary Method Validation Summary Suppression/Enhancement Suppression/Enhancement
Cost/hr 100 100 100 100 Summary of Regression Constants Summary of Regression Constants
Total Cost 22,400 1,900 11,200 1,450 Unique QC Low for Matrix Effects Unique QC Low for Matrix Effects
Cost Savings/Report Cost Savings/Report 20,500 9,750 Time/Temp Stability in Matrix Time/Temp Stability in Matrix
Freeze/Thaw Stability Freeze/Thaw Stability
Time/Temp Final Extract Stability Time/Temp Final Extract Stability
Time/Temp Stock Solution Stability Time/Temp Stock Solution Stability
2
Report Writing Cost Savings Per Year
Single-Analyte Studies
3
Report Writing Cost Savings Per Year 4-Analyte
Studies
Recommended
CrystalGraphics Presentations


