
Monday, August 27th - PowerPoint PPT Presentation
1 / 28
Title:
Monday, August 27th
Description:
Title: Scientific Method Author: Cheryl Massengale Last modified by: stephanie.spurlock Created Date: 9/18/2001 3:26:13 AM Document presentation format – PowerPoint PPT presentation
Number of Views:62
Avg rating:3.0/5.0
Title: Monday, August 27th
1
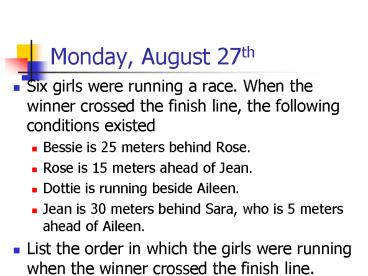
Monday, August 27th
- Six girls were running a race. When the winner
crossed the finish line, the following conditions
existed - Bessie is 25 meters behind Rose.
- Rose is 15 meters ahead of Jean.
- Dottie is running beside Aileen.
- Jean is 30 meters behind Sara, who is 5 meters
ahead of Aileen. - List the order in which the girls were running
when the winner crossed the finish line.
2
Scientific Method
3
Steps in the Scientific Method
- Question
- Observation
- Hypothesis
- Experiment
- Data Collection
- Conclusion
- Retest
4
Question
- Must be testable.
- Should ask about real objects or situations.
5
Observations
- Gathered with your senses
- A scientist notices something in their natural
world
6
Observations
- An example of an observation might be noticing
that many salamanders near a pond have curved,
not straight, tails
7
Hypothesis
- A suggested solution to the problem.
- Predicts an outcome by answering the question.
8
Hypothesis
- An example of a hypothesis might be that the
salamanders have curved tails due to a pollutant
in the moist soil where they live.
9
Experiment
- A procedure to test the hypothesis.
10
Scientific Experiments Follow Rules
- An experimenter changes one factor and observes
or measures what happens.
11
Variables
- The factor that I, the experimenter,
controls/changes is the independent variable. - The factor that is measured or observed is called
the dependent variable.
12
Example of Constants Variables
- For example, suppose you want to figure out the
fastest route to walk home from school. - You will try several different routes and time
how long it takes you to get home by each one. - Since you are only interested in finding a route
that is fastest for you, you will do the walking
yourself.
13
What are the Variables in Your Experiment?
- Varying the route is the independent variable
- The time it takes is the dependent variable
- Keeping the same walker throughout makes the
walker a constant.
14
One more thing it is best to make several trials
during an experiment.
15
Control Group and Experimental Group
- Control Group group that nothing happens to
(provide an idea of what is normal) - Experimental Group group that is subjected to
experimental variables
16
(No Transcript)
17
Data
- Results of the experiment
- May be quantitative (numbers) or qualitative
18
Data
- Must be organized
- Can be organized into charts, tables, or graphs
19
Conclusion
- The answer to the hypothesis based on the data
obtained from the experiment
20
Conclusion
21
Retest
- In order to verify the results, experiments must
be retested.
22
Solving a Problem
- 1) Identify a Problem (Question)
- 2) State Observations about the problem
- 3) Form a Hypothesis about the problem (ifthen)
- 4) Design an Experiment to test the hypothesis
- 5) Collect Data
- 6) Form a Conclusion
- 7) Retest
23
Scientific Method
24
Tuesday, August 28th
- Read the following experiment and identify the
independent and dependent variables.
Sue wants to determine which type of dog food
will help her dog lose the most weight. She sets
up an experiment in which she feeds her dog a
different food each week for three weeks. On
Monday, Wednesday, and Friday of each week she
weighs her dog.
25
To Do List
- Complete Sample Lab Activity
- Get checked off when complete
- Experimental Design Worksheet
- Turn in to tray
26
Looking at Sample Labs
- Work with your group to find the following
information for each sample lab - Independent Variable
- Dependent Variable
- Constants
- Conclusion
27
Practice
- Experimental Design Worksheet
- Work individually on the worksheet
- Read carefully and use your notes!
28
Graphs!
- Pie Graphs percents that add to 100
- Bar Graphs data in numbers and words
- Line Graphs data in numbers
- Scatter Plots data is plotted using X and Y axis
Complete the Graphing Skills Worksheet. Due
Wednesday!
Recommended
CrystalGraphics Presentations


