
The Management Cycle in a Public Institution - PowerPoint PPT Presentation
Title:
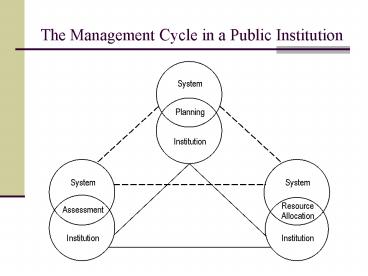
The Management Cycle in a Public Institution
Description:
Title: PowerPoint Presentation Author: Preferred Customer Last modified by: Jay R Created Date: 2/21/2003 8:28:42 PM Document presentation format – PowerPoint PPT presentation
Number of Views:61
Avg rating:3.0/5.0
Title: The Management Cycle in a Public Institution
1
The Management Cycle in a Public Institution
2
Client ExpectationsThe State
- Expansion and Diversification of the Economy
- Improving Performance of K-12 Education
- Contributing to Solution of Problems Normally
Addressed in Other Agencies of State Government - Social Services
- Corrections
- Environmental Quality
- Labor/Commerce
- Etc.
3
Student Pipeline Of 100 9th Graders the number
who graduate from high school within four years,
go directly to college, return their second year,
and graduate within 150 of program time (2000)
4
Interstate Migration of Adults with a Bachelors
Degree or Higher Change in Stock of Adults with
a Bachelors Degree or Higher Minus Number of
Bachelors Degrees Awarded (1990 to 2000) 25-
to 64-Year-Olds
200
193
(In Thousands)
167
106
82
74
67
64
58
44
33
21
20
15
0
2
-1
-4
-7
-8
-9
-12
-10
-13
-14
Texas
Idaho
-17
-17
Virginia
Alaska
-19
Florida
Arizona
Georgia
Oregon
Nevada
-24
Maryland
-27
Colorado
-30
Washington
New Jersey
-37
New Mexico
Wyoming
North Carolina
-46
Minnesota
-49
Tennessee
Hawaii
-50
-51
-51
-53
Montana
Maine
-57
Delaware
Arkansas
Vermont
-72
South Carolina
-75
Kentucky
South Dakota
-79
-80
Nebraska
Utah
-88
North Dakota
Kansas
-93
New Hampshire
Illinois
Mississippi
Connecticut
-109
West Virginia
-120
-124
Rhode Island
California
Iowa
Wisconsin
Oklahoma
-138
Alabama
Louisiana
Missouri
Indiana
Michigan
-173
-200
Massachusetts
Ohio
From 1990 to 2000, Wisconsin Produced 272,629
Bachelors Degrees While the Number of Adults
25-64 with a Bachelors Degree or Higher Rose by
197,940
-281
Pennsylvania
-400
-380
New York
Source U.S. Census Bureau, IPEDS Completions
Survey, Tom Mortenson, Postsecondary Opportunity
5
The Flow of Funds
6
Change in Resident Undergraduate Student Charges
and State Appropriations, Public Colleges and
Universities, 1990-91 to 2001-02
Source AASCU/NASULGC 2001
7
State Comparisons Index ScoresAffordability
Weights within the Family Ability to Pay
indicators are based on enrollment by type of
institution. The zero score for Wyoming on
Family Ability to Pay at Private 4-Year Colleges
is weighted at zero, and as a result does not
affect the states overall grade for
affordability. Actual Index Score is over 100.
Notes Numbers in bold refer to best-performing
states.
8
Percentage Change in Spending to Maintain Current
Services
Source Rockefeller Institute of Government 2002
9
State and Local Surplus or Shortfall as a Percent
of Baseline Revenues in Year 2010
Source Rockefeller Institute of Government 2002
10
State Tax Capacity and Effort (Index Scores) -
Wisconsin
Source State Higher Education Executive
Officers, Kent Halstead
11
State Appropriations for Higher Education vs.
Family Share of Higher Education Funding (Index
Scores) - Wisconsin
Source State Higher Education Executive
Officers, Kent Halstead
12
Higher Education Priority Higher Education
Appropriations as a Percent of Tax Revenue (Index
Score) - Wisconsin
Source State Higher Education Executive
Officers, Kent Halstead
13
State Strategies Used to Reduce Budget Gaps,
Fiscal Year 2002
14
Total Research and Development Expenditures Per
Capita () - 2001
Source National Science Foundation, US Census
Bureau
15
Federal Research and Development Expenditures Per
Capita () 2001
Source National Science Foundation, US Census
Bureau
16
State, Local, and Institutional (Internal)
Research and Development Expenditures Per Capita
() 2001
Source National Science Foundation, US Census
Bureau
Recommended
CrystalGraphics Presentations


