
Two researcher interfaces - PowerPoint PPT Presentation
1 / 56
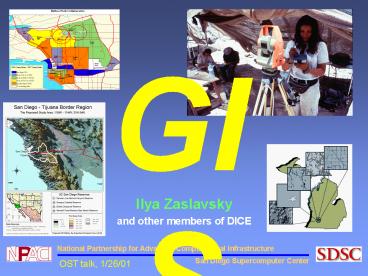
Title: Two researcher interfaces
1
GIS
Ilya Zaslavsky and other members of DICE
2
Outline
- Whats a GIS
- Applications, ArcView demo
- Myths
- Some interesting problems
- GIS on the Web, and XML
3
Simple Definition
- GIS Maps in Computers
4
Smart Maps
Site Number Bacteria 104
50
5
What Is GIS - a Brief Introduction
a system of hardware, software, data, people,
organizations and institutional arrangements for
collecting, storing, analyzing, and disseminating
information about areas of the earth (Dueker and
Kjerne, 1989)
- Different mapping systems
- Electronic atlases
- Thematic mapping systems
- Street-based mapping systems
- GIS all these things much more
- analysis, import/export, combination of different
data, dynamic map update, etc
6
How GIS Works
- Link map features to tables of attributes
- Access the attributes for any map feature
- Locate any feature from its attributes
- Manage sets of features attributes as themes or
objects
- Integrate sources
- - Primary sources
- - Secondary sources
7
Integrate Sources
8
Geographic Database
Framework Data
Thematic Data
9
Exploring Relationships
- Based on geographic location and proximity, GIS
makes connections between activities - Looking at data geographically can often suggest
new insights, explanations - These connections are often unrecognized
without GIS, but can be vital to understanding
and managing activities and resources - E.g., we can link pollution sources with disease
patterns
10
Combining data sets
l
l
l
l
l
l
l
l
l
l
l
l
l
l
l
l
l
l
l
Pollution Sources
Leukemia Cases
11
Information about where allows us to combine
heterogeneous data sets
12
Space as an indexing system
Rivers
Settlements
Admin. Units
Reference Grid
Latitude
Longitude
13
Projections
- Example The Mercator projection has straight
meridians parallels that intersect at right
angles, as opposed to the Robinson projection. - Mercator preserves area only at the equator and
at two standard parallels equidistant from the
equator. - The Mercator projection is often used for marine
navigation as all straight lines on the map are
lines of constant azimuth. - Any one projection cannot simultaneously preserve
all these qualities of the world shape, area,
direction, and distance.
14
This is what happens when projections mix!
- Notice the boundary lines do not line up
- Points that are placed on the wrong projection
will be misaligned as well
15
What does it mean doing GIS?
- Using the tools of GIS to solve a problem
- Helping to build the tools
- Adding to existing geographic information
technologies - Helping to invent or develop new ones
- Studying the theory and concepts that lie behind
GIS and the other geographic information
technologies - Studying the societal context of geographic
information - The legal context
- Issues of privacy, confidentiality
- Economics of geographic information
16
GIS in Higher Education
- ESRI list of GIS programs
- http//gis.esri.com/university/onlinedb.cfm
- GIS Programs in Higher Education
- http//www.directionsmag.com/education/
- Geography departments worldwide
- http//geowww.uibk.ac.at/geolinks/
- Directory of graduate schools, GIS programs
- http//www.gradschools.com/listings/menus/geoinfos
ys_menu.html
17
GIS Curriculum - 1
- UCSB (http//www.geog.ucsb.edu/programs/ugrad_cour
ses.htm ) - Geog 12 - Maps and Charts, 4.0, Clarke
- Geog 13 - Introduction to Computing in Geography,
2.0, Staff - Geog 115A - Geographic Photo Interpretation, (T),
4.0, Estes - Geog 115AL - Laboratory in Geographic Photo
Interpretation, (T), 1.0, Estes - Geog 115B - Geographic Remote Sensing Techniques,
(T), 4.0, Mertes - Geog 115BL - Lab in Geographic Remote Sensing
Techniques, (T), 1.0, Mertes - Geog 115C - Intermediate Geographic Remote
Sensing Techniques, (T), 4.0, Mertes - Geog 115CL - Laboratory in Intermediate
Geographic Remote Sensing Techniques, (T), 1.0,
Mertes - Geog 118 - Production Cartography, (T), 4.0,
Clarke - Geog 128 - Analytical and Computer Cartography,
(T), 4.0, Staff - Geog 136 - Remote Sensing of the Oceans, (GT,
UT), 4.0, Washburn - Geog 138 - Remote Sensing of the Atmosphere An
Introduction, (T), 4.0, Gautier - Geog 151 - Computational Methods for Watershed
Analysis, (T), 5.0, Mertes - Geog 172 - Introduction to Geographical Data
Analysis, (T), 3.0, Montello - Geog 172L - Laboratory in Introductory
Geographical Data Analysis, (T), 2.0, Montello - Geog 176A - Introduction to Geographic
Information Systems, (T), 4.0, Goodchild, Clarke - Geog 176B - Technical Issues in Geographic
Information Systems, (T), 4.0, Goodchild, Clarke - Geog. 176BL - Lab in Geographic Information
Systems I, (T), 1.0, Goodchild, Clarke
18
GIS Curriculum - 2
- SDSU http//typhoon.sdsu.edu/
- GEOG 380 Map Investigation
- GEOG 381 Map and Graphic Methods
- GEOG 385 Spatial Data Analysis
- GEOG 484 Geographic Information Systems
- GEOG 488 Remote Sensing of Environment
- GEOG 581 Cartographic Design
- GEOG 582 Automated Cartography
- GEOG 584 Geographic Information System
Applications II - GEOG 585 Quantitative Methods in Geographic
Research - GEOG 588 Intermediate Remote Sensing of
Environment - GEOG 682 Advanced Automated Cartography
- GEOG 683 Advanced Geographic Information Systems
- GEOG 685 Advanced Quantitative Methods in
Geography - GEOG 688 Advanced Remote Sensing
- GEOG 780 Seminar in Techniques of Spatial
Analysis
- University of Washington
- 258 Maps and GIS
- 360 Principles of Cartography
- 458 Map Sources and Errors
- 460 Geographical Information System Analysis
- 461 Urban Geographic Information Systems
- 463 Geographic Information Systems Workshop
- 465 Analytic Cartography
- Western Michigan University
- 375 Intro to GIS
- 582 Remote Sensing of the Environment
- 566 Field Geography
- 567 Computerized Geodata Handling and Mapping
- 569 Geographic Information System
The NCGIA Core Curriculum in GIScience
19
Applications
20
Redistricting
21
Disaster recovery
22
Floodplain mapping
500 year flood
100 year flood
Hurricane Floyd
Flooding in Greenville
23
Regulation implementation enforcement
100 year flood
Hurricane Floyd
Hog lagoons in and out of the floodplain
24
Watershed planning
25
Zoning
26
Smart growth
27
Police and fire deployment
28
Residential development
29
Economic development
30
Fund allocation
Prime Farmland in Johnston County
31
Intelligent demographics
32
Citizen access to public data
Preserved Lands in North Carolina
33
Myths
34
Some Myths About GIS
- GIS provides an objective approach to
information - Data may be different methods may be different
- Similar GIS for the same area will lead to
similar conclusions and policy recommendations - Attitudes may be different
- Digital geographic data are accurate
- Well and there are so many ways to measure data
quality - Better information will make better decisions
- Another top 5 and another and another . 6
myths! - Technical issues are fundamental in GIS
35
Summary of annual hazardous waste crossing the
U.S./Mexico border during 1995-1997 (tons/yr)
HAZTRAKS (EPA) Border Maquilas (INE) Transport from U.S. Industries to Mexico (INE)
1995 8,510 33,187
1996 6,983 72,113 230,417
1997 11,057 76,808 284,921
EPAEnvironmental Protection Agency
INEInstituto Nacional de Ecología About 2 of
the hazardous wastes generated in the border
states
- procedural differences in accounting
- incomplete coverage
- regional differences
- differences between industries
Source Robert G. Varady, Robert G. Arnold, Dean
E. Carter, Roberto Guzmán, Carlos Peña, William
A. Suk, 2000 Hazardous Waste and the
U.S.-Mexico Border Region
36
(No Transcript)
37
Some Interesting ProblemsSemanticTechnicalStati
stical
38
sometimes, the distinction between discrete and
continuous is not very clear
GIS representation
reality
39
Objects versus Fields
- Object viewempty space littered with objects
(points, lines or areas) - Field viewvalue is defined for every location
40
Objects
41
Fields
Raster grid
Regular point grid
Irregular points
Contour lines
42
AUTOCORRELATION Land Use Maps Example
- Categorical maps inherently autocorrelated
- Degree of autocorrelation depends on resolution
In vector database
- if areas of polygons Area Lim(NS), where
N - number of cells, S - size of a cell, S
--gt0 autocorrelation extremely
positive - if counts of polygons no adjacent polygons
with the same value
autocorrelation extremely negative
43
MAUP - Modifiable Areal Unit Problem
- Group of problems
- Scale (The larger the unit of aggregation, the
larger, on average, is the correlation between
two variables) - Aggregation (Taylor and Johnston (1979) in The
geography of elections obtained a 0.44
correlation between rural non-farm voting for
Nixon in 1960 using Census nine-region division
and a -0.22 correlation using the four-region
division) - Openshaw, Taylor 1979 A million or so
correlation coefficients three experiments with
the modifiable areal unit problem - How to solve MAUP (Openshaw, 1983)
- ...it is not likely that solution exists that
would allow the use of traditional techniques - ...the simplest is to pretend that it doesn't
exist - ...the most convenient solution - to accept that
zoning systems are independent of the phenomena
they are used to report
44
GIS on the Web
45
Opportunity in Web-based Mapping
- Disaster relief and Emergency management
- Global and national geospatial information
infrastructures - Digital Earth, NSDI, GSDI
- Crime management
- Environmental Monitoring
- Many others...
World Wide Web
Clients
Internet
Servers
FTP
46
Web Mapping Defined
Web servers and map viewer clients interact to -
- Discover, access and retrieve views from
multiple servers
- Display multiple layers of geographic data
within a single web application
- Query and update
- Provide interface for visualization, Decision
Support, etc.
- Support geocoded raster, vector, matrix, and
other data
47
Mapping on the Web Today
How can I combine data from each of these sources
to answer my question?
48
Web Mapping TodayCharacteristics
- Specialized applications that meet specific needs
- Relatively easy to use
- Limited ability to integrate information from
other sources
49
Web Mapping Technology Initiative - Method --New
Way of Doing Business
- Bring together web mapping technology developers
and users from around the world - Develop multi-use (civil, business, military,
etc) open technology interfaces - Rapidly document open interface specifications
- End result are Standards-based commercial
off-the-shelf (SCOTS) products.
50
The Three Architecture Cases
The Graphic Element Case
The Data Case
The Picture Case
(source OpenGIS document 99-077)
51
Architectures for Different Applications
- Each map request sends new geometry
- Examples find by address or another attribute
routing, single-attribute maps, weather maps,
etc. - In general situations when geometry is defined
by attribute (categorical coverages, for example) - Geometry remains relatively constant
- Examples atlases, statistical maps for
collection zones (states, counties, census
tracts) - In general situations with many attributes for
limited number of geometries - For the latter case makes sense to cache and
re-use coordinate information on the client side
as much as possible. For each application, there
is some right mix of the two approaches.
52
XML the emerging Web data interchange standard
- XML eXtensible Markup Language
- Supports semi-structured data provides for
semantic tagging, separation of content from
presentation - W3C recommendation, 1998
- XML for 2D vector rendering
- 1st generation VML, PGML
- 2nd generation SVG (W3C Candidate
Recommendation) - XML for expressing geographic coordinates
- GML (Geographic ML), etc need to be rendered in
VML, SVG or similar for vector display
53
GIS XML 1st experiment (the data)
54
GIS XML 1st experiment (XML wrapping)
55
GML
- GML XML specification to encode geo. info.
- For both Data Storage Data Transport
- Initial release deals with OGC Simple Features
- vector geodata e.g. digital map info (streets,
population, land use zones, property lines,
watersheds, etc.) - 3 profiles from lite to RDF, but likely to
change with XML schemas - GML is not concerned with the visualization of
geographic features (drawing of maps)
Graphic format
Direct rendering
Direct routing w.o. viz.
Numerical model
GML in XML
Transformation into a vector graphics rendering
format
- SVG
- VML
- VRML
56
From Geography Markup to Rendering
lt?xml version"1.0" encoding"iso-8859-1"?gt ltrsgt lt
rgtltnamegtHorton Plazalt/namegtltURLgtlt/URLgtltlabelposgt41
.46,77.51lt/labelposgtltcgt5076,1540 4986,1540
4895,1539 4803,1539 4715,1539 4622,1539 4534,1538
4534,1641 4534,1745 4534,1856 4622,1856 4711,1856
4800,1856 4893,1855 4984,1855 5075,1854 5075,1749
5076,1646 lt/cgtlt/rgt ltrgtltnamegtGaslamplt/namegtltURLgtlt/U
RLgtltlabelposgt44.60,83.00lt/labelposgtltcgt5162,1013
5084,1057 5083,1116 5081,1222 5079,1326 5079,1433
5076,1540 5076,1646 5075,1749 5075,1854 5167,1854
5257,1855 5257,1750 5259,1647 5260,1541 5262,1434
5262,1328 5263,1222 5263,1013 lt/cgtlt/rgt . . .
XML encoding of geographic features (such as GML)
57
Applications XML-based mediation for spatial
data sources
Native XML/VML repository
58
Some examples
- MCSP
- Vietnam War
- Witchcraft project
- Michigan Atlas
- LTER
- Amer Transportation Survey
- Quality of Life in San Diego maps
- Rat Brain Atlas (the SMaRT tool)
Recommended
CrystalGraphics Presentations


