
Image Thresholding - PowerPoint PPT Presentation
Title:
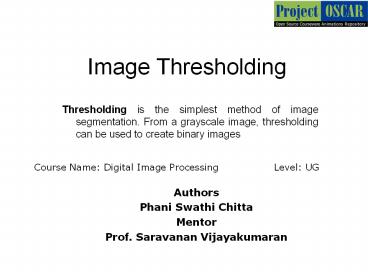
Image Thresholding
Description:
Course Name: Digital Image Processing Level: UG Authors Phani Swathi ... Richard E. Woods, second edition, Pearson Education Research papers: ... – PowerPoint PPT presentation
Number of Views:168
Avg rating:3.0/5.0
Title: Image Thresholding
1
Image Thresholding
- Thresholding is the simplest method of image
segmentation. From a grayscale image,
thresholding can be used to create binary images
Course Name Digital Image Processing
Level UG
Authors Phani Swathi Chitta Mentor Prof.
Saravanan Vijayakumaran
2
Learning Objectives
- After interacting with this Learning Object, the
learner will be able to - Understand how the thresholding of an image is
done
3
Definitions of the components/Keywords
1
- During the thresholding process, individual
pixels in an image are marked as object pixels
if their value is greater than some threshold
value (assuming an object to be brighter than the
background) and as background pixels if their
value is less than threshold value - Typically, an object pixel is given a value of
1 while a background pixel is given a value of
0 - The key parameter in the thresholding process is
the choice of the threshold value
2
3
4
5
4
Master Layout
1
Transformation graph
Original Image
2
255
Output s
3
0 30 255
input r
Graph for T30
4
- Give a slider ranging from 0 to 255 so that user
can select any one threshold value. - The graph should also vary along with the slider
depending on threshold value.
5
5
Step 1
Threshold value 0
1
2
3
4
Instruction for the animator Text to be displayed in the working area (DT)
The first fig. should appear and then when the slider points at 0, the second fig. should be shown The text in DT should appear in parallel to the figures The original image The resulting image when the threshold value is 0
5
6
Step 2
Threshold value 10
1
2
3
4
Instruction for the animator Text to be displayed in the working area (DT)
The first fig. should appear and then when the slider points at 10, the second fig. should be shown The text in DT should appear in parallel to the figures The original image The resulting image when the threshold value is 10
5
7
Step 3
Threshold value 25
1
2
3
4
Instruction for the animator Text to be displayed in the working area (DT)
The first fig. should appear and then when the slider points at 25, the second fig. should be shown The text in DT should appear in parallel to the figures The original image The resulting image when the threshold value is 25
5
8
Step 4
Threshold value 50
1
2
3
4
Instruction for the animator Text to be displayed in the working area (DT)
The first fig. should appear and then when the slider points at 50, the second fig. should be shown The text in DT should appear in parallel to the figures The original image The resulting image when the threshold value is 50
5
9
Step 5
Threshold value 75
1
2
3
4
Instruction for the animator Text to be displayed in the working area (DT)
The first fig. should appear and then when the slider points at 75, the second fig. should be shown The text in DT should appear in parallel to the figures The original image The resulting image when the threshold value is 75
5
10
Step 6
Threshold value 100
1
2
3
4
Instruction for the animator Text to be displayed in the working area (DT)
The first fig. should appear and then when the slider points at 100, the second fig. should be shown The text in DT should appear in parallel to the figures The original image The resulting image when the threshold value is 100
5
11
Step 7
Threshold value 125
1
2
3
4
Instruction for the animator Text to be displayed in the working area (DT)
The first fig. should appear and then when the slider points at 125, the second fig. should be shown The text in DT should appear in parallel to the figures The original image The resulting image when the threshold value is 125
5
12
Step 8
Threshold value 150
1
2
3
4
Instruction for the animator Text to be displayed in the working area (DT)
The first fig. should appear and then when the slider points at 150, the second fig. should be shown The text in DT should appear in parallel to the figures The original image The resulting image when the threshold value is 150
5
13
Step 9
Threshold value 175
1
2
3
4
Instruction for the animator Text to be displayed in the working area (DT)
The first fig. should appear and then when the slider points at 175, the second fig. should be shown The text in DT should appear in parallel to the figures The original image The resulting image when the threshold value is 175
5
14
Step 10
Threshold value 200
1
2
3
4
Instruction for the animator Text to be displayed in the working area (DT)
The first fig. should appear and then when the slider points at 200, the second fig. should be shown The text in DT should appear in parallel to the figures The original image The resulting image when the threshold value is 200
5
15
Step 11
Threshold value 215
1
2
3
4
Instruction for the animator Text to be displayed in the working area (DT)
The first fig. should appear and then when the slider points at 215, the second fig. should be shown The text in DT should appear in parallel to the figures The original image The resulting image when the threshold value is 215
5
16
Step 12
Threshold value 230
1
2
3
4
Instruction for the animator Text to be displayed in the working area (DT)
The first fig. should appear and then when the slider points at 230, the second fig. should be shown The text in DT should appear in parallel to the figures The original image The resulting image when the threshold value is 230
5
17
Step 13
Threshold value 250
1
2
3
4
Instruction for the animator Text to be displayed in the working area (DT)
The first fig. should appear and then when the slider points at 250, the second fig. should be shown The text in DT should appear in parallel to the figures The original image The resulting image when the threshold value is 250
5
18
Step 14
Threshold value 255
1
2
3
4
Instruction for the animator Text to be displayed in the working area (DT)
The first fig. should appear and then when the slider points at 255, the second fig. should be shown The text in DT should appear in parallel to the figures The original image The resulting image when the threshold value is 255
5
19
Electrical Engineering
Slide 1
Slide 3
Slide 20, 21
Slide 23
Slide 22
Introduction
Definitions
Test your understanding (questionnaire)?
Lets Sum up (summary)?
Want to know more (Further Reading)?
Analogy
Interactivity
Try it yourself
- Select any one of the figures
- a b
- c d
- Select threshold value between 0 - 255
- Give a slider ranging from 0 to 255 so that user
can select any one threshold value.
19
Credits
20
Questionnaire
1
- Thresholding can be used to create binary images
from - Answers a)colour image b) gray scale image
c) Either a or b
d)? Both a and b - 2. If the threshold value is 200, what is the
output of the given image - Note Gray colour value is 150
- Answers a) b) ?
- c) d)
2
3
4
5
21
Questionnaire
1
3. If the threshold value is 125, what is the
output of the given image Note Gray colour
value is 150 Answers a)
b) ? c)
d)
2
3
4
5
22
Links for further reading
- Reference websites
- http//en.wikipedia.org/wiki/Thresholding_28imag
e_processing29 - Books
- Digital Image Processing-
- Rafael C. Gonzalez, Richard E. Woods, second
edition, Pearson Education - Research papers
23
Summary
- Thresholding is the simplest method of image
segmentation. From a grayscale image,
thresholding can be used to create binary images - During the thresholding process, individual
pixels in an image are marked as object pixels
if their value is greater than some threshold
value (assuming an object to be brighter than the
background) and as background pixels if their
value is less than threshold value - Typically, an object pixel is given a value of
1 while a background pixel is given a value of
0
Recommended
CrystalGraphics Presentations


